The new Data Profiling features of the upcoming OWB release will knock your socks off. Other new features are applicable, useful, and successfully augment the product and make it better. Data Profiling opens up a whole new world to OWB with it’s wide applicability outside of Oracle Business Intelligence. In other words, readers should note that this feature is not just for OWB Developers but rather could merit firing up OWB purely to use this feature. OWB developers might be a bit disappointed with how OWB works to manage corrections, which are based on the output from Data Profiling but that shouldn’t dissuade anyone from using this feature.
Most BI and Data Warehousing professionals fancy themselves experts of their organizations’ data; they think they understand their structures, volume, and understand how they live and breathe. In other words, if you are curious which data in your enterprise is least clean consult your DW operations staff and they’ll provide anecdotal tales of why the POS system is a POS (different acronym) and that they “often get erroneous transactions with special adjustment code 99.” What is typical, and ironic given the DW mandate of providing insight and information, is that the DW team can not quantify and measure the quality of their data. What kind of questions could you use to drive data quality initiatives in your enterprise? Knowing the cost of scrubbing and manually restating (Sarbanes-Oxley consultants cringe here) data and the overall cost of making decisions by delayed or improper data wouldn’t you want to know where to start working?
Data Profiling addresses many needs by providing a set of functionality to examine, profile, and measure the quality of data. It provides a set of screens that allow you to point the application at a Data Source and immediately get some valuable information about your data. The Data Profiling features of OWB fall into three broad categories:
- Attribute Analysis : This type of profiling revolves around the content and structure of particular attributes in your data sets. This involves numerical precisions, distinct values, outlier identification, min/max/avg, declared types versus actual types, and pattern typing.
- Referential Analysis : Understanding how data relates to other data is a very important component of data profiling. They wouldn’t call it a relational database if the relationships amoungst data weren’t one of the fundamental and most important concepts of data organization. Identifying orphans, joins, childless entries, and redundancy identification all fall under the umbrella of Referential Analysis.
- Functional Analysis : Beyond the pure join relationships, there are also ways of surmising how the data functionally relates to each other. One can surmise the relationship between attributes and relationships for determination and dependencies. Normalization candidate identification can be achieved by leveraging this analysis (identify which attributes might be prime candidates for factoring out and normalizing into an exterior table).
While it might not be as small as a Fax Wizard the Data Profiling features of OWB require a sort of linear progression, especially early on in the process. This makes sense; you have to connect to your data, identify which data is of interest, retrieve and analyze your data, explore and understand your data, and optionally deploy code to monitor and make corrections to your data.
I’ve included a few screenshots, which speak quite clearly to the types of analysis that OWB can perform on your data. It should be noted, that since Oracle retrieves and analyzes the data in a temporary workspace that one can perform this analysis on data contained in nearly any heterogenous supported connection, including plain old flat files.
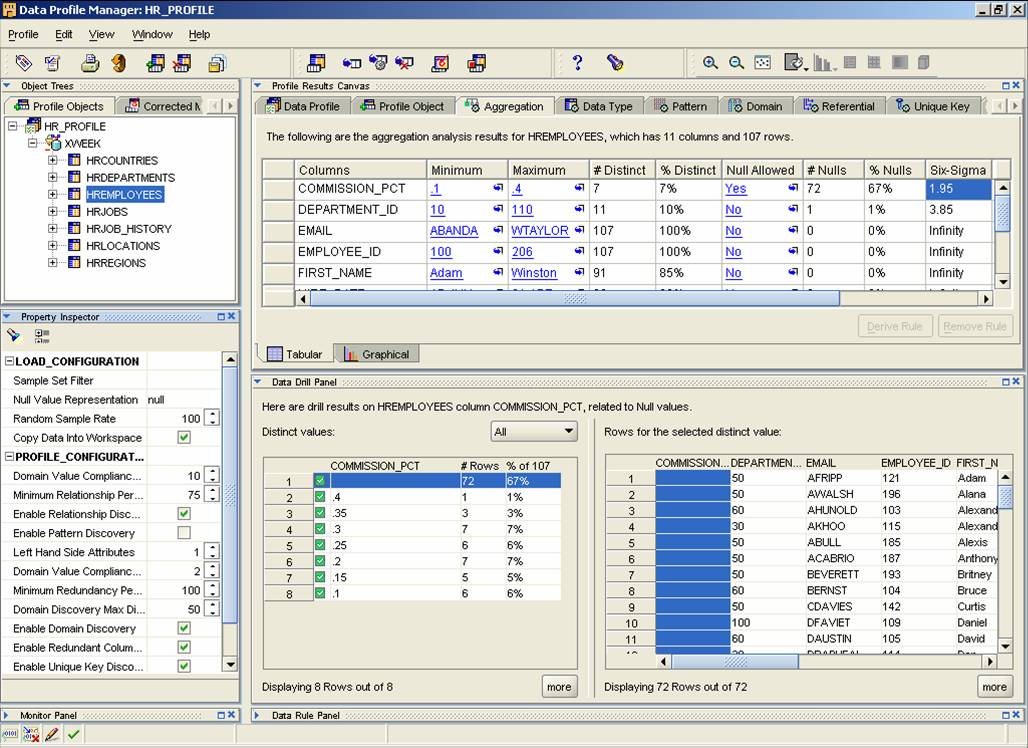
Figure 1. Screenshot of some of the aggregation statistics available. Note the ability to actually see the detail rows here
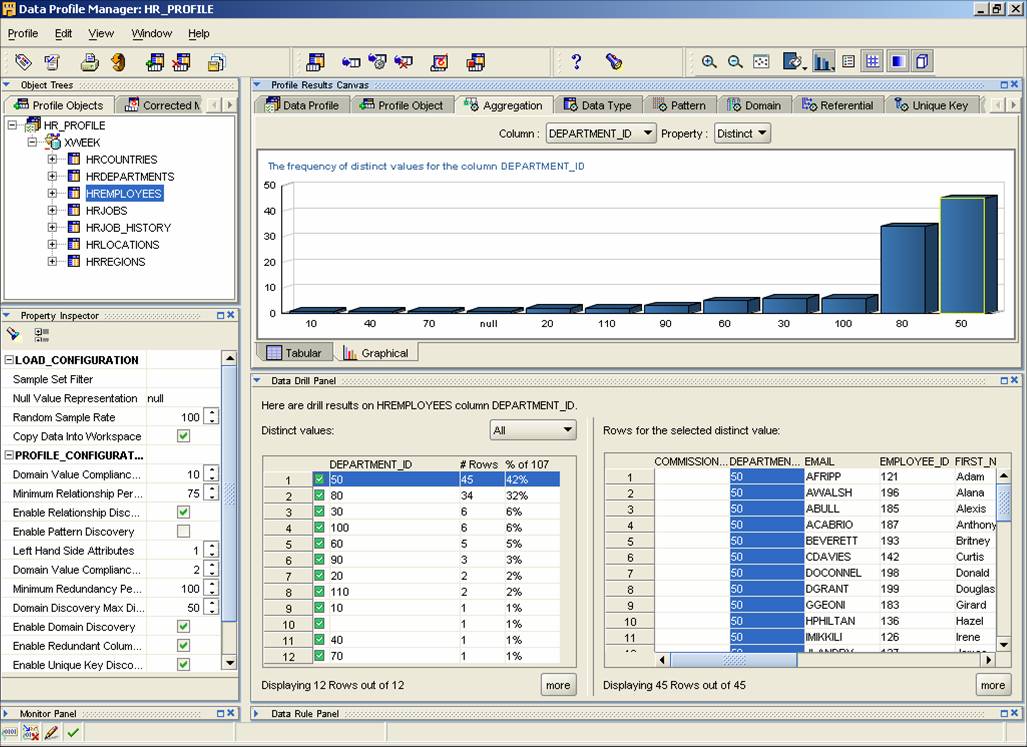
Figure 2. If you don’t feel like consuming the analysis in numerical form OWB provides a way to visualize characteristics of your data
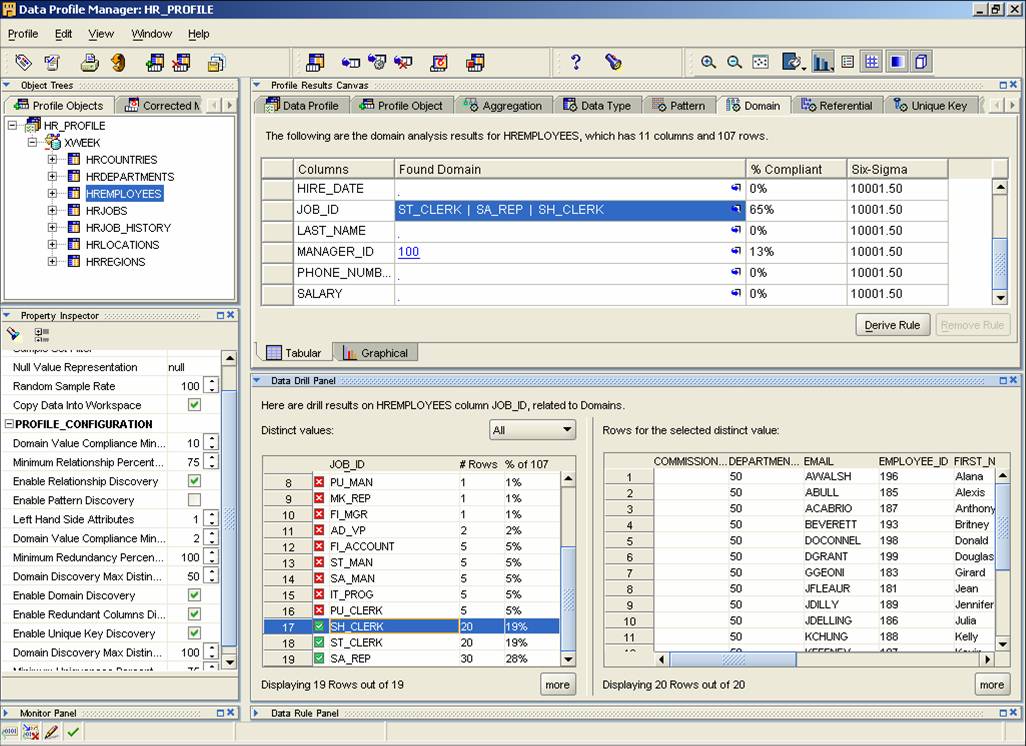
Figure 3. Domain stats are very useful for determining status codes, valid product categories, etc. It also shows details and percentages
Probably the feature Oracle is hoping you’ll use most, and why Data Profiling is included in OWB instead of an alternate tool or standalone product is OWB’s ability to monitor and make corrections to data based on the work one does in the Data Profiling section of the product. OWB endeavors to allow you to quickly, and programatically leverage the results of an analysis into working monitors and data cleansing routines. It’s a noble start at implementing easy rule based automated ETL generation and cleansing of data but has some difficulties in ongoing management. See Note Number 1 Below
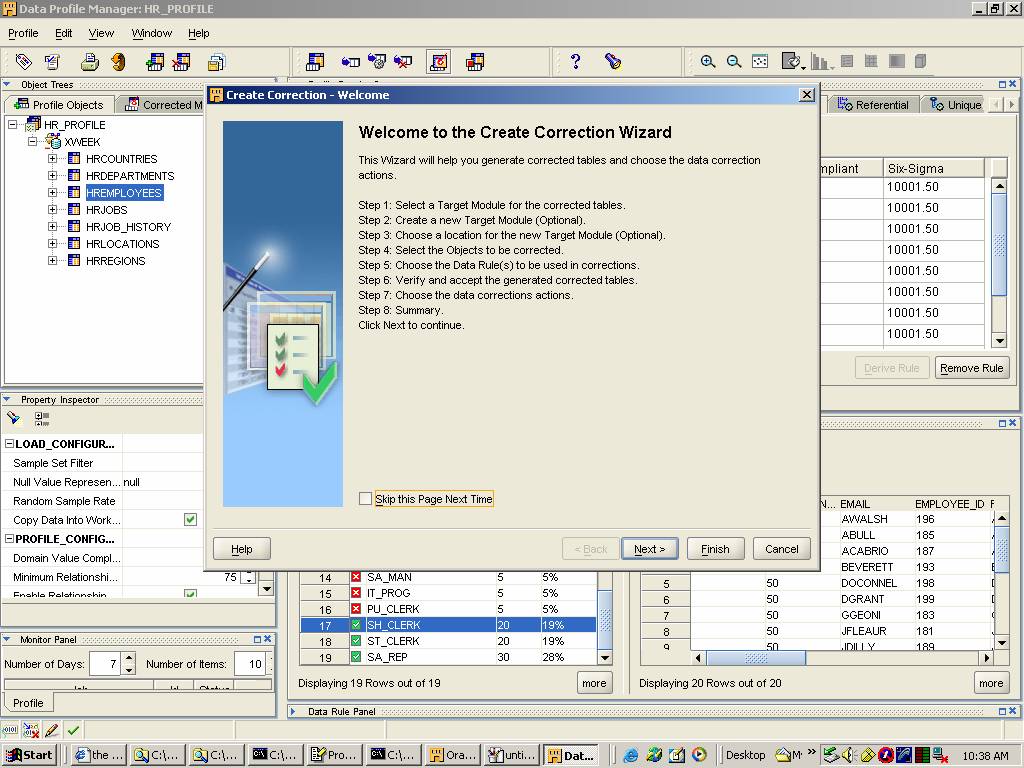
Figure 4. Based on a rule you’ve defined as part of your profiling, launch the Create Correction wizard
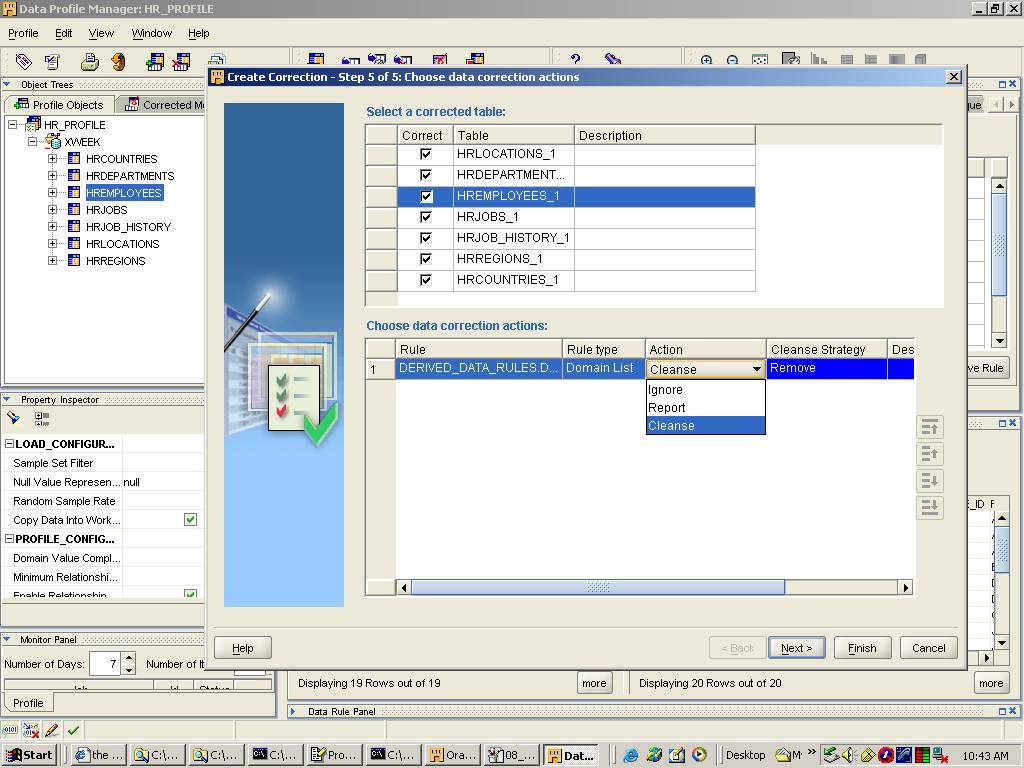
Figure 5. One can define several actions that are implemented to “correct” the data. There are some excellent capabilities for the correction action (Match Merge, Remove, etc)
One can create rules and corrections from inside the Data Profiler that can be deployed to correct and audit your data. Consider a real life example of a data source that contains order information, including order status history records. An order will contain information about the Customer, order amount, etc. Order History records contain information about what occurred to the order and when (received by warehouse, shipped, etc). You’ve analyzed your current data set using the data profiler and you’ve found that Order History records arrive with status codes that are two letter codes, but occasionally) when orders are forced to a different status an operator uses mixed case (“Sh” instead of “SH”) for the status codes. You’ve got 100k order statuses conforming to your dictionary of status codes, and a couple hundred that are off by one lower case character. Your company is entitled to a 10k discount from your fulfillment partner company every month the error rate exceeds .5% off the agreed upon data formats.
How can you leverage the new OWB feature to: audit the error rates of the received data; and correct the simple case of mixed case status codes?
- Connect to and identify the data of interest. Depending on the arriving format for the data, you’ll need to decide how to get it imported into the land of OWB and the Data Profiler. If it’s in a SQL Server or Oracle database you can enter in some connection information and connect directly and browse the data dictionary. If it’s in a flat file, you’ll need to sample and describe the data file.
- Run the profiler. Review the information that you’re seeing about the particular attribute(s) in question. In our example we’re interested in the STATUS CODE column of the order history records. The profiler will indicate a suggested domain (valid uppercase status codes) and then indicate how many (and %) records do not conform to those specifications. You can drill into these (VERY USEFUL feature) records to see that nearly all are still valid two letter codes, but have mixed case.
- Derive a Rule based on the domain of the records. You select the attribute, and use the Derive Rule wizard to create a rule that says the STATUS CODE must be one of the valid upper case codes.
- Create a correction based on the rule. You’ve now created a rule that specifies valid values for that column. How does one make corrections to these records so that they can be processed along with their compliant peers? Using the create correction wizard you can specify how to react to the rule violation. In this case one would use some of the provided logic (match merge capabilities of OWB) and define the logic for identifying the mixed case codes, and correct them by applying some TO UPPER CASE logic. This will create a mapping and other requisite structures for executing the logic. Note: The fact that the corrections are themselves OWB objects is a blessing and a curse. More on that toward the end of this article
- Add the mapping to your process flows. This will execute, in the place you deem it necessary where the data will be evaluated and possibly corrected.
- Schedule an auditing process. Outside of the correction execution you might just want to evaluate the state of the data so that you have a record of data received, it’s error rates, why it failed it, etc. You can do an audit ad-hoc, scheduled, or within a process flow. Naturally many locations will like to retrieve data from their source systems, perform the audit as part of the process flow, and then proceed with any correction and further warehouse processing.
Data Profiling is a very worthwhile feature in the upcoming release of OWB. It is certainly useful to a BI consultant who needs to quickly learn and understand a customers data. I hope readers find it as useful as I have.
This blog is part of the OWB Paris Early Review series which reviews and comments on several new Paris features.
NOTE 1: Corrections are generated in a one time process and it generates all sorts of OWB objects (mappings, tables, etc) to accomplish a correction. While this is handy, I’m guessing the ongoing management will be difficult. OWB creates one of their new “nested” mappings for implementing the cleansing rule and then the OWB developer includes this pluggable mapping in your ETL(you can run it standalone if you so choose). It’s a one time generation and you can’t manage the rule. If you change your correction (include this NEW particular code or type) you have to regenerate the correction and possibly re-add it to your ETL.
NOTE 2: Thanks to Paul and Nikolai for their contribution to this blog.