Category Archives: Uncategorized

SQL access to CouchDB views : Easy Reporting

Following up on my previous blog about enabling SQL Access to CouchDB Views I thought I’d share what I think the single, biggest advantage is: The ability to connect, run of the mill, commodity BI tools to your big data system.

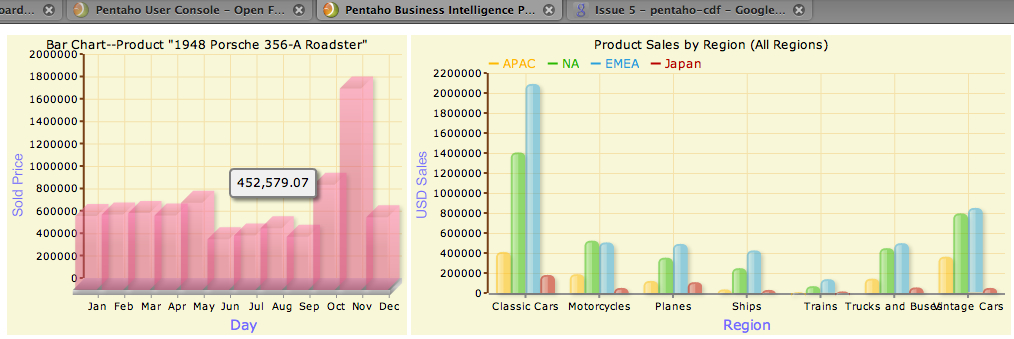
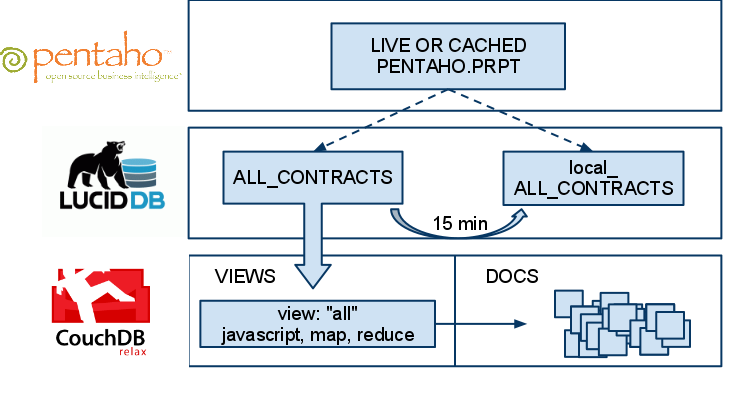
While the video below doesn’t show a PRPT it does show Pentaho doing Ad Hoc, drag and drop reporting on top of CouchDB with LucidDB in the middle, providing the connectivity and FULL SQL access to CouchDB. Once again, the overview:

HotorCold.png

BI Tools are commoditized; consider all the great alternatives available inexpensively (either in Open Source for free, Open Core, or even simply proprietary). Regardless of what solution you choose, these tools have fantastic, easy to use capabilities that are very easy for business users to build their own reports. After all, shouldn’t your developers be extending/creating new applications instead of fiddling with what filters your analysts/executives want to see on their dashboard?

Driving the developer out (as much as possible) is one of the best reasons to try and enable your cool, CouchDB views via SQL.

Here I’ll demonstrate, once we’ve connected LucidDB to our CouchDB view, how a BI Tool can:

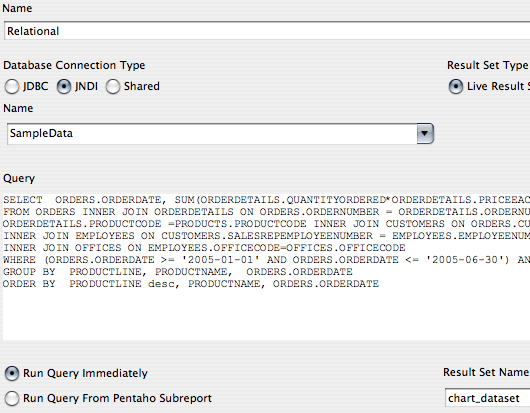
  • Easily see the data, and understand it’s datatypes. Metadata is well understood between SQL databases and BI tools.
  • We can easily use a familiar query language, SQL, that allows for aggregation, filtering, and limiting. This gives a huge swath of BI tools the ability to talk to CouchDB.
  • We translate the SQL we receive into optimized* RESTful HTTP view requests.

Per a reader suggestion here’s a video showing the solution, as opposed to the screenshots (PS – Let us know what you  think about the CouchDB SQL access, or also the Video vs Screenshot approach).

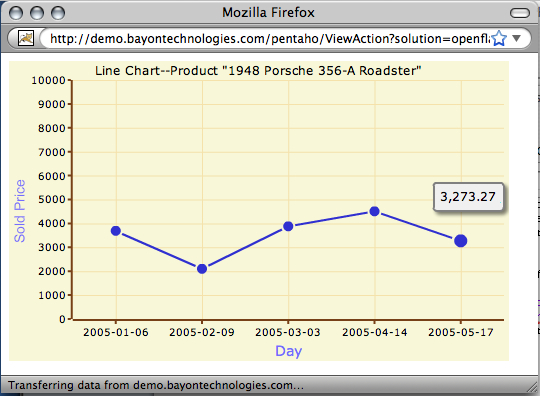
It picks up right after the previous section. Once we have that CouchDB view in LucidDB then Pentaho (or other BI tools) can connect and access, do ad hod reporting like they always have). As a certified database for Pentaho, you can be quite comfortable that Pentaho will work very very well with LucidDB.

PENTAHO does not even KNOW it’s talking to CouchDB -> It has NO idea; Pentaho thinks it’s a database just like any other

Without further delay:

*optimized = we have a few optimizations available to us, that we’ve not yet put into the connector. For instance, the ability to filter to a particular key (where key = XYZ) pushed down, or group_level=*. This will come over time as we enhance the connector. For now, we’re doing very little in terms of pushing down SQL filters/aggregations into the HTTP view. However, your view itself is almost CERTAINLY aggregated and doing this anyhow.

We’re keen on discussing with CouchDB/Hive/other Big Data users about their Ad Hoc and BI needs; please visit the forum thread about the connector.

SaaS or On Site? Who cares with Pentaho On Demand

Pentaho launched their On Demand initiative today: Press Release.

While the launch is new, I know that Pentaho has already onboarded some customers in a quiet soft launch and the response has been very positive.  Why wouldn’t it be?  This offering is the best of both worlds, and makes purchasing a business department driven BI project easy.

SaaS BI’s key selling point (there are many small, nice to haves, but the thing that gets people to reach for their wallet) is the ability to get a solution with an almost total lack of IT involvement.  Throw in non cap-ex expenditures for the solution (4k USD / mo instead of a 30k license) and it’s a huge win.

Business users have their data (feeds, dumps, extracts, or connections to DBs), have the budget but then need the tools/expertise to get their BI system “up and running.”  SaaS and On Demand BI is a perfect fit for these customers – up and running quickly.  Where it breaks down, is that with a SaaS offering, once you go SaaS you can’t EVER go back.  You’re stuck with a solution built entirely upon a proprietary, vendor controlled software and infrastructure.

Recap:

Biggest draw of SaaS is quick easy startup without IT, and smaller monthly pay as you go
Biggest drawback of SaaS is lock in like you’ve never seen before.  Not just software, but operations as well.

That’s why I find the Pentaho On Demand BI initiative to hit the middle of the sweet (suite?) spot.  It is absolutely the best of both worlds.

Their On Demand offering allows

  • Business sponsors to get a complete BI suite up and running quickly (72 hr challenge is wicked cool) without IT involvement (or minimal).
  • Incremental, pay as you go billing.  This is huge – not sure your BI project will generate a return?  Spin up Pentaho On Demand, do the 72 hr challenge, and shop it around the demo to the users for a month or two.
  • This is what knocks it out of the park though; Once you’re done with your eval/build out you have so many options whereas with pure SaaS you don’t.  Not what the users wanted? No problem: throw it away.  Is what they want?  Keep going On Demand?  On Demand not something your IT likes -> bring it On Site.  That’s right, Pentaho and their hosting partners have designed their On Demand offering to permit shutdown and transport of the machine VMWare images in house.  Even without that, just getting your Pentaho Solution you can install Pentaho locally and run it in house with your reports/cubes/dashboards.

On Demand BI won’t be for everyone – it’s still geared towards people wanting a complete suite of BI tools, and are willing to pay for a private, secure Pentaho instance in the cloud.  SaaS BI will still be better for people who actually prefer ZERO infrastructure and for those that don’t have the budget for a private infrastructure (if you have $100 / mo for BI, this isn’t right for you).

Great news for “frustrated with IT but still wanting to build out a real, long term BI solution” analysts everywhere.  🙂

DynamoDB: Time Dimension table with MERGE

So, even with my disclaimer note on the last blog, the DynamoDB developers slapped me around a bit for suggesting using a view for a Time Dimension. The Time Dimension is the most important dimension table and should be an actual table, not a view. Creating the table allows us to perform all kinds of optimizations like star joins, bitmap indexes on attributes, etc. Probably wouldn’t be that big of a deal for a tiny fact table (< 5million records) but you’ll want CREATE TABLE if you want good performance.

Good news is, that we can use our exact same table function (with fiscal year offset)

select * from table(applib.fiscal_time_dimension (2000, 1, 1, 2009, 12, 31, 3))

to populate and keep our Time Dimension TABLE up to date.

If you use a TABLE, it’s 2 steps:

  1. CREATE TABLE : “dim_time”
  2. POPULATE TABLE : “merge into dim_time”

We’ll be using another great tool in the DynamoDB / LucidDB toolkit, the MERGE statement. The MERGE statement is a logical UPSERT. It checks to see if key is already present. If it is, we UPDATE the table. If it isn’t, we INSERT it into the table. I’ll go into more detail at some point in the future as MERGE is crucial for keeping dimensions up to date.

Let’s create our Time Dimension table:

create table dim_time (
FISCAL_YEAR_END_DATE DATE
, FISCAL_YEAR_START_DATE DATE
... ABBREVIATED ...
, TIME_KEY DATE
, TIME_KEY_SEQ INTEGER
,constraint dim_time_pk primary key (day_from_julian));

NOTE: We’ve abbreviated the statements, but all the columns are used in the actual scripts. We also should add bitmap indexes on YR, MONTH, etc columns.

We’ve now got a TABLE that matches the VIEW we created in the previous blog. We’ve made day_from_julian as our PK, and we’ll use this date as our key for the MERGE statement. We can run this query as many times as we like and it will always just keep our “dim_time” table up to date.

merge into dim_time using (select * from
      table(applib.fiscal_time_dimension (2000, 1, 1, 2010, 12, 31, 3))) src
on dim_time.day_from_julian = src.day_from_julian
when matched then UPDATE set
FISCAL_YEAR_END_DATE=src.FISCAL_YEAR_END_DATE
,FISCAL_YEAR_START_DATE=src.FISCAL_YEAR_START_DATE
... ABBREVIATED ...
,TIME_KEY=src.TIME_KEY
,TIME_KEY_SEQ=src.TIME_KEY_SEQ
when not matched then INSERT
(FISCAL_YEAR_END_DATE
 , FISCAL_YEAR_START_DATE
... ABBREVIATED ...
 , TIME_KEY
 , TIME_KEY_SEQ)
values(
src.FISCAL_YEAR_END_DATE
 , src.FISCAL_YEAR_START_DATE
... ABBREVIATED ...
 , src.TIME_KEY
 , src.TIME_KEY_SEQ);

What if Hot Dog vendors sold you Power Tools?

Well, since it’s been topical, and I can never resist an urge to discuss open source licensing…

What do you buy from a Hot Dog Vendor? Hot Dogs, duh!

What do you buy from an Office Supplies Vendor? Office Supplies, duh!

What do you buy from (most) Open Source Vendors? Proprietary Software, … huh?

Let’s do this another way…

What do you get if you buy Yellow Products? Products that are Yellow, duh.

What do you get if you buy Enterprise Software Products? Products that are fit for use by Enterprises, duh!

What do you get if you buy (most) Open Source Products? A proprietary product built on an open source project, … huh?

If you want to be called a “insert term here” vendor should sell “insert term here.” Otherwise you aren’t really “vending” it, you’re just using it as part of a strategy, marketing, development method, etc. Which, in my opinion, is what open source is: A way to develop and distribute software, not what you are selling. Very few of the open source companies actually sell an “Open Source Product.” They sell a proprietary one and services built on top of a great open source project, aka Open Core.

Most “Open Core” companies should simply be defined as “Software Companies with exceptional Open Source development models.” You can not purchase an “open source product” from an Open Core company. You can purchase their proprietary product on top of the open source project, but there is no product you can buy that is “open source” from most Open Core companies.

See the difference? Product and Project are not the interchangable. Vendor and “Model/Company” are not interchangable.

Don’t get me wrong – I’m no enemy of Pentaho by any means; quite the opposite. Just last week I wholeheartedly recommended to a customer they renew their EE subscription based ONLY on the new Pentaho Analyzer (which is GREAT, btw)!  It doesn’t negate the value they sell to customers, Open Core companies still deliver exceptional value.  I don’t call in to question the validity of the Open Core model and it’s mutual benefit for those involved (as James points out consistently in his BeeKeeper).

Open Core Companies just shouldn’t be surprised when people experience cognitive dissonance when they buy a proprietary product without an open source license from an “open source vendor.”

Pentaho Solutions Book

I wonder how many people can we get looking like this?

In all seriousness, the book looks great.  Will bring it on my next extended plane ride – already saw a brilliant diagram (Figure 9-2 on page 234) that perfectly shows PDIs “streaming” architecture.  So, Amazon apparently was trying to exceed expectations (you’ll get by 9/11) but here I have it in hand.

Will put together a more thoughtful review and post it here for those that might be on the fence about buying it.  Based on my initial look, I’m sure the book is worth well beyond its price as a practical guide for using Pentaho.

Twitter is what blogging was 4 years ago?

I had an email from a good friend, whom I actually got to know through mutual open source interests, but also by simply discussing topics on my blog.  He writes:

Whether you like it or not, twitter is now what blogs were 3 or 4 years ago, and you need to get involved in it, Nick.

Twitter seems like a medium that while easy and fast, is ill suited to the topics I like to blog about.  Technical articles, tips, with samples and screenshots seems like it would be tough to get across on Twitter.  I tried twitter – actually, ages ago but then deleted my account almost immediately because I just thought it was downright “silly” to “text the world” 150 characters at a time.

What am I missing?  My friend quoted above is highly regarded, certainly by me.  What am I missing?  Why would I want to communicate to the world in medium without image, italics, attachments, etc?  Phrasing it more positively, what is the best part about Twitter that makes it work foregoing time spent on this blog for Tweeting instead?

Encrypted Variables in PDI

Every once in a while, I get to sound like a royal arse in front of a customer by saying something “I know” to be true about Pentaho that isn’t.  Usually, this is a REALLY good thing because it’s usually some limitation, or Gotcha that existed in the product that has magically disappeared with the latest release.  The danger of open source is that these things can change underneath you quickly, without any official fan fare and leave you looking like a total dolt at a customer site.  Bad for consultants like me who are constantly having to keep up with extraordinarily fast product development.  Good for customers because they get extraordinarily fast product development.

One of these experiences, which I was absolutely THRILLED to look like a dolt about, was

“If you use variables for database connection information, the password will be clear text in kettle.properties.” 

A huge issue for many security conscious institutions.  Customers were faced with a choice: use variables which centrally manages the connection information to a database (good thing) but then the password is clear text (bad thing).  No longer!

Our good friend Sven quietly committed this little gem nearly 18 months ago. It’s been in the product since 3.0.2!  It allows encrypted variables to be decrypted in the password field for database connections.

Let’s test it out… our goal here is to make sure we can get a string “Encrypted jasiodfjasodifjaosdifjaodfj” which is a simple encrypted version of the password to be set as a regular ole variable but then be used as the “password” of a database connection.

We have a transformation that will set the variables, and then we’ll use that variable in the next transformation.

The first one sets the variable ${ENCRYPTED_PASSWORD} from a text file.  This string would be “lifted” from a .ktr after having been saved that represents the encrypted password.

Then we use it in the next transformation and select from a database, and outputs the list of tables in the database to a text file.

Output – works like a charm! 

Customers can now have the best of both worlds.   Centralize their variables for host/user/password using variables (including, kettle.properties) and keep those passwords away from casual hackers.  I say casual because PDI is open source so in order for someone to decrypted a password they only need know Java, and know where to find PDI SVN.  🙂

As always, example attached: encrypted_variables.zip

PentahoFlashChart: Basics

PentahoFlashChart is a component built for Pentaho 2.0.stable (or Enterprise Edition) that allows you to render flash charts in the User Console and Dashboards. It uses the flash library “Open Flash Chart 2.0” which is an LGPL licensed SWF. The charts are NOT available for rendering in Pentaho Reporting or Pentaho Report Designer.

Let’s first understand what we’re talking about: Consider the following example run from Bayon’s ‘demo’ server.

NOTE: This demo server is not a 100% uptime server – if you don’t see anything above don’t worry. Check back later.

A chart can be rendered via a URL:

200901081053

via the Pentaho User Console:

200901081054

via Dashboards (JSP/AJAX/CDF):

200901081055

The PentahoFlashChart component is intended to be used, like any other component, from an .xaction which is created in the Pentaho Design Studio.

You can follow download this example here: ofc_linechart.xaction

Just like any chart or report, you have to get your data for reporting. In this case, we’re getting a Relational data set from the Pentaho SampleData data source.

200901081059

We also have a “chart template” which is an XML document VERY similar (same same but different) to the pentaho chart xml definition that defines how to build the chart. It contains things like chart tile, chart type, etc. The “chart template” is really where most of the “interesting” work occurs.

<chart><chart-type>LineChart</chart-type><title>Line Chart–Product “1948 Porsche 356-A Roadster”</title><x-steps>1000</x-steps><x-max>20000</x-max><domain-title>Day</domain-title><range-title>Sold Price</range-title><y-axis><labels></labels><y-steps>1000</y-steps><y-max>10000</y-max><color>#909090</color></y-axis></chart>

Notice that this chart template has a <chart-type>LineChart</chart-type> which means that the component will output a LineChart in Open Flash Chart. The full scope of the tags, and all their functioning is beyond the scope of this intro article and it should also change. The next release of PentahoFlashChart should be 100% compatible with the Pentaho Chart XML definition. We’ll see. 🙂

This renders the flash fragment to the page, with a “callback” for the data file that has been added to the content repository.

Consider installing it into Pentaho 2.0.stable and playing with it. The sample solution comes with 11 Examples so it should be relatively easy to get going, even though it lacks good documentation.

200901081110

It’s great for dashboards, and produces some great looking (if not limited) charts.

Beautiful Flash Charts: Part II

So, it appears as if there was some pent up demand for great looking flash charts. The brief couple of days that my initial post on my rough integration work with Open Flash Charts I’ve had:
– 2 Pentaho Partners ask for the solution so they can start using it
– 3 Community members ask about it (including one who started but never finished a similar task)
– An existing customer decide to implement it

Cool! As an open source guy, I believe in early and often, so I’m posting my .xactions for this stuff here.

Installation Steps

  1. Have a working Sample BI Server
  2. Drop open-flash-chart-.swf into pentaho-demo/jboss/server/default/deploy/pentaho-style.war pentaho-demo/jboss/server/default/deploy/pentaho-style.war/images (nice catch in comments below)
  3. Drop flash_chart_example_bar.xaction and flash_chart_example.xaction into pentaho-solutions/samples/charts

That should you get two the sample bar chart and the sample pie chart working.

These action sequences are kind of fancy. They do a fair bit of string replacements, result set walking, etc. So, they aren’t for the casual user but if you’ve done some Pentaho stuff before you’ll be able to work your way through it.

The interesting part is really the “datacall=true” branch. The first time the action sequence is called it returns a fragment of code that contains the flash object.

<object classid=”clsid:d27cdb6e-ae6d-11cf-96b8-444553540000″ codebase=”http://fpdownload.macromedia.com/pub/shockwave/cabs/flash/swflash.cab#version=8,0,0,0″ width=”600″ height=”500″ id=”graph-2″ align=”middle”><param name=”allowScriptAccess” value=”sameDomain” /> <param name=”movie” value=”/pentaho-style/images/open-flash-chart.swf?width=600&height=500&data=http%3A//localhost%3A8080/pentaho/ViewAction%3Fsolution%3Dsamples%26path%3Dcharts%26action%3Dflash_chart_example_bar.xaction%26datacall%3Dtrue” /> <param name=”quality” value=”high” /><param name=”bgcolor” value=”#FFFFFF” /> <embed src=”/pentaho-style/images/open-flash-chart.swf?width=600&height=500&data=http%3A//localhost%3A8080/pentaho/ViewAction%3Fsolution%3Dsamples%26path%3Dcharts%26action%3Dflash_chart_example_bar.xaction%26datacall%3Dtrue” quality=”high” bgcolor=”#FFFFFF” width=”600″ height=”500″ name=”open-flash-chart” align=”middle” allowScriptAccess=”sameDomain” type=”application/x-shockwave-flash” pluginspage=”http://www.macromedia.com/go/getflashplayer” /> </object>

In this fragment, the flash object is given a “datafile” location which is the same action sequence but with a datacall=true.

The datacall=”true” basically returns a text file that looks like this:

&y_min=0& &y_max=40000000& &y_steps=4& &title=Actual vs Budget by Region,{font-size:20px; color: #bcd6ff; margin:10px; background-color: #5E83BF; padding: 5px 15px 5px 15px;}& &y_legend=USD,12,#736AFF& &x_labels=Central,Eastern,Southern,Western& &x_axis_colour=#909090& &x_grid_colour=#D2D2FB& &y_axis_colour=#909090& &y_grid_colour=#D2D2FB& &bar_glass=55,#D54C78,#C31812,Actuals,12& &values=37893162,35248940,35248940,35248940& &bar_glass_2=55,#5E83BF,#424581,Budget,12& &values_2=38397600,35487861,34803861,34510067&

This text file is really what gives the flash chart it’s form, labels, and data.

Again, this is quick and dirty implementation but it’s a life saver if you need something more than the charting in the platform.

Beautiful Flash Charts for Pentaho

I’ve worked on several customer dashboards and found the charting in Pentaho to be pretty good in a lot of circumstances, but lacking for a lot of circumstances. In particular, certain shading, animations, etc aren’t supported in Pentaho charts (based on JFreeChart).

There are a bunch of Flash charting libraries, and I recently worked with a customer that was using “Open Flash Charts.” I helped them get Mondrian data streaming through to this flash charting engine. I was surprised to find that the library is open source, and is moving to LGPL (away from GPL) to ensure that people feel comfortable embedding it in their applications.

I started integrating these charting capabilities with Pentaho to see how the charts look. I was seeing some really great results. The integration was done via a fair amount of fancy Javascript/Xaction sequence stuff but this integration did not require any custom Java application work. Just Pentaho .xactions and the basic open-flash-chart.swf. I might start looking at building a small little JSP library to help with some of this.

The first one I built was a little pie chart, that has a nice animation (copied and pasted here without the dynamic .xaction stuff)

The second one I built was this beautiful bar chart, comparing actuals and budgets.

In all cases, if you’re needing some “more” from Pentaho in terms of data visualization, don’t hesitate to be in touch. This flash chart is the latest in a series of dashboards that Bayon has been building for customers.

UPDATE: I built another one for a new customer, and changed the data labels for presentation here. Having a grand time with open flash chart. This chart below is the output of an MDX query to Mondrian. The one is the metric ( a base measure ) the other is a running total.