Monthly Archives: February 2009

Make Mondrian Dumb

I had a customer recently who had very hierarchical data, with some complicated measures that didn’t aggregate up according to regular ole aggregation rules (sum, min, max, avg, count, distinct count). Now, one can do weighted averages using sql expressions in a Measure Expression these rules were complex and they also were dependent on the other dimension attributes. UGGGGH.

Come to that: their analysts had the pristine, blessed data sets calculated at different rollups (already aggregated to Company Regions). Mondrian though, is often too smart for it’s own good. If it has data in cache, and things it can roll up a measure to a higher level (Company Companies can be rolled up to Regions if it’s a SUM for instance) Mondrian will do that. This is desirable in like 99.9% of cases. Unless, you want to “solve” your cube and just tell Mondrian to read the data from your tables.

I started thinking – since their summary row counts are actually quite small.

  1. What if I could get Mondrian to ignore the cache and always ask the database for the result? I had never tried the “cache=” attribute of a Cube before (it defaults to true and I work with that 99.9% of the world). Seems like setting it to false does the trick. Members are read and cached but the cells aren’t.
  2. What if I could get Mondrian to look to my summary tables for the data instead of aggregating the base fact? That just seems like a standard aggregate table calculation. Configure an aggregate table so Mondrian will read the Company Regions set from the aggregate instead of the fact

Looks like I was getting close to what I wanted. Here’s the dataset I came up with to test:

mysql> select * from fact_base;
+----------+-----------+-----------+
| measure1 | dim_attr1 | dim_attr2 |
+----------+-----------+-----------+
| 1 | Parent | Child1 |
| 1 | Parent | Child2 |
+----------+-----------+-----------+
2 rows in set (0.00 sec)

mysql> select * from agg_fact_base;
+------------+----------+-----------+
| fact_count | measure1 | dim_attr1 |
+------------+----------+-----------+
| 2 | 10 | Parent |
+------------+----------+-----------+
1 row in set (0.03 sec)

mysql>
Here’s the Mondrian schema I came up with:

<Schema name=”Test”>
<Cube name=”TestCube” cache=”false” enabled=”true”>
<Table name=”fact_base”>
<AggName name=”agg_fact_base”>
<AggFactCount column=”fact_count”/>
<AggMeasure name=”[Measures].[Meas1]” column=”measure1″ />
<AggLevel name=”[Dim1].[Attr1]” column=”dim_attr1″ />
</AggName>
</Table>
<Dimension name=”Dim1″>
<Hierarchy hasAll=”true”>
<Level name=”Attr1″ column=”dim_attr1″/>
<Level name=”Attr2″ column=”dim_attr2″/>
</Hierarchy>
</Dimension>
<Measure name=”Meas1″ column=”measure1″ aggregator=”min”>
</Measure>
</Cube>
</Schema>

Notice that the aggregate for Parent in the agg table is “10” and the value if the children are summed would be “2.” 2 means it agged the base table = BAD. 10 means it used the summarized data = GOOD.

The key piece I wanted to very is that if I start with an MDX for the CHILDREN and THEN request the Parent will I get the correct value. Run a cold cache MDX to get the children values:

200902181235

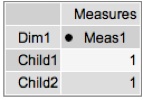
Those look good. Let’s grab the parent level now, and see what data we get:
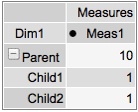
200902181235-1

The result is 10 = GOOD! I played around with access methods to see if I could get if messed up and on my simple example it didn’t. I‘ll leave it to the comments to point out any potential issues with this approach but it appears as if setting cache=”false” and setting up your aggregate tables properly will cause Mondrian to be a dumb cell reader and simply select out the values you’ve already precomputed. Buyer Beware – you’d have to get REALLY REALLY good agg coverage to handle all the permutations of levels in your Cube. This could be rough – but it does work. 🙂 And caching – it always issues SQL so that might be an issue too.

Sample: cachetest.zip

Mondrian – you’ve been dumbed down! Take that!!!
Self Service Data Export using Pentaho

Every BI installation has power users that just want “data dumps.” They may need the dumps for a variety of reasons:

  • You’ve built crappy reports. They can’t get the information they need in *YOUR* reports.
  • They need to feed the data into another system. They want to select all customers who bought product X in time period Y to send them a recall notice. Need a dump of email / addresses to send them the notice.
  • They are addicted to Excel; they feel like a super hero whizzing through the data making fancy graphs and doing a few of their own ratios/calculations.
  • They want to munge the numbers. They will export it to Excel, throw out the data that makes them look bad, and then present it to their boss with shiny positive results.

I had a customer who needed something to “feed the data to another system.” Their original approach was to write a Pentaho Report that formatted to CSV well, write the parameterized query, and then simply generate the report and return it in the browser. This seems like a sound approach and would have been my first as well. They found that it did work well, to a point. It looked as if the Pentaho Report layer tends to use a bunch of memory for report generation – this is understandable. The report object is being rendered but is only “returned” to Pentaho when it’s complete. The entire dataset must be in memory. Well, needless to say, with this customers heap configuration they found a row threshold (30,000) that caused their Pentaho 1.6 installation to croak.

However, they didn’t really need to be using Pentaho Reporting. Kettle, which is included in Pentaho BI Suite has an straightforward performant way to export to CSV. If we could generate that file, and then simply return the file that we just generated to the browser we’d have an elegant solution for data export.

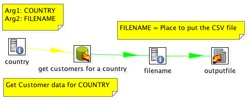
The first piece of the puzzle is the data export KTR. This KTR takes two arguments: Country and Filename. The Country is the value that will limit the data set that we are outputing (output customers in Italy). The Filename is the location to put the file. This isn’t necessary, but it allows the FILENAME to be set by the caller (.xaction) instead of callee (ktr). It’s for convenience.

200902090955

I’ve created a directory in tomcat/webapps/ named “lz”, short for landing zone. This /lz/ directory is accessible via the web browser. By placing this in this location we can use the same tomcat server that is hosting Pentaho to serve up our data export file as well.

Now, let’s get to a little bit of the magic of the Action Sequence, data_export.xaction.
200902091000

The first thing this action sequence does is to create a list of countries, and then prompt the user to select one. This is pretty standard stuff, done all the time with Pentaho reports so we won’t cover the specifics here.

Once we’ve got our “country” defined, we call our “Pentaho Data Integration” KTR component with two arguments. The first is the country the user has just selected and the second is the filename that we’ve hard coded as an input to our action sequence. The filename is the location on the local filesystem you would like kettle to generate the file at (ie, /apps/pentaho/tomcat/webapps/lz/data_export_file.csv).

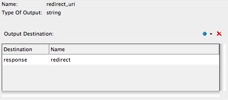
Once we’ve generated the file in that location, we’ll send a redirect to the user as the “output” of this action sequence. The user doesn’t really “see” this; the user will just see the .csv arrive in their browser. The way to get the redirect to work is to add the output to “response.redirect” like so:
200902091005
The redirect URI is another hard coded value: /lz/data_export_file.csv which should reference the path of the file on the web server.

The user experience is indistinguishable from standard reports. User is prompted:

200902091010

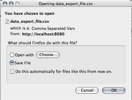
they click “OK” and are prompted what do do with their export.
200902091011

The performance of this solution far surpasses using Pentaho Reporting. Exports of 10,000 rows that were taking 30-60 seconds were taking 10-15 seconds. However, be warned. The export via Kettle will only have as many formatting options as are present in the “Text File Output” step which are many, but limited. If you need fine control over the format of your data export, you may have to stick with Pentaho Reporting since it does provide a superior set of layout/formatting controls.
It should also be noted that this works with zipped files (to zip up the .csv), and also .XLS exports. I’ve provided this sample (data_export.zip) that works with Pentaho 2.0 BI (Needs hypersonic sample database). You’ll have to adjust the “filename” variable to your filesystem before running it for it to work properly (it has the location of my installation).