Monthly Archives: June 2008

Ordered Rows in Kettle

There was a question posed the other day on the Pentaho forums about how to get Kettle to process “all the rows” at one step before beginning execution on the others. Sven suggested to use the “execute once for every row” as a solution which I think is probably overall, a cleaner way to accomplish a multistep process. However, it is possible to do this in Kettle now.

The solution is to add “Blocking Step”s in your transformation where you need the whole thing to have completed before continuing processing.

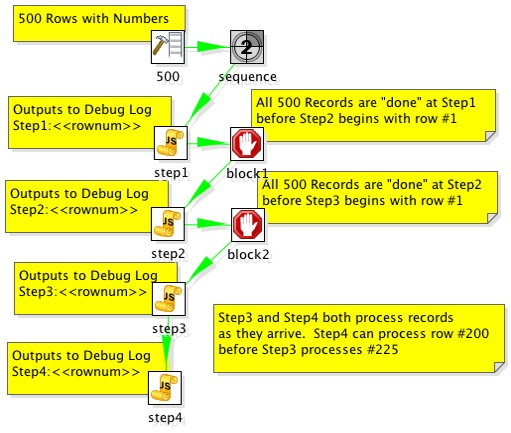
Consider the following example:

200806251534

The step “block1” does not pass rows to Step2 until all rows have finished at Step1. This accomplishes the desired outcome of ensuring that all records have completed processing on step1 before step2 processes. The example transformation outputs to the debug log and it’s clear that they are output in the correct order.

2008/06/25 15:25:04 - step1.0 - Step1:1
2008/06/25 15:25:04 - step1.0 - Step1:2
2008/06/25 15:25:04 - step1.0 - Step1:3
2008/06/25 15:25:04 - step1.0 - Step1:4
2008/06/25 15:25:04 - step1.0 - Step1:5
...
2008/06/25 15:25:05 - step1.0 - Step1:499
2008/06/25 15:25:05 - step1.0 - Step1:500
...
2008/06/25 15:25:05 - step2.0 - Step2:1
2008/06/25 15:25:05 - step2.0 - Step2:2
2008/06/25 15:25:05 - step2.0 - Step2:3
2008/06/25 15:25:05 - step2.0 - Step2:4
2008/06/25 15:25:05 - step2.0 - Step2:5
...
2008/06/25 15:25:05 - step2.0 - Step2:499
2008/06/25 15:25:05 - step2.0 - Step2:500
...
2008/06/25 15:25:05 - step3.0 - Step3:1
2008/06/25 15:25:05 - step3.0 - Step3:2
2008/06/25 15:25:05 - step3.0 - Step3:3
2008/06/25 15:25:05 - step3.0 - Step3:4
2008/06/25 15:25:05 - step3.0 - Step3:5
2008/06/25 15:25:05 - step3.0 - Step3:6
2008/06/25 15:25:05 - step3.0 - Step3:7
2008/06/25 15:25:05 - step4.0 - Step4:1
2008/06/25 15:25:05 - step3.0 - Step3:8
2008/06/25 15:25:05 - step4.0 - Step4:2
2008/06/25 15:25:05 - step3.0 - Step3:9
2008/06/25 15:25:05 - step4.0 - Step4:3
2008/06/25 15:25:05 - step4.0 - Step4:4

Example here: ordered_rows_example.ktr

Beautiful Flash Charts: Part II

So, it appears as if there was some pent up demand for great looking flash charts. The brief couple of days that my initial post on my rough integration work with Open Flash Charts I’ve had:
– 2 Pentaho Partners ask for the solution so they can start using it
– 3 Community members ask about it (including one who started but never finished a similar task)
– An existing customer decide to implement it

Cool! As an open source guy, I believe in early and often, so I’m posting my .xactions for this stuff here.

Installation Steps

  1. Have a working Sample BI Server
  2. Drop open-flash-chart-.swf into pentaho-demo/jboss/server/default/deploy/pentaho-style.war pentaho-demo/jboss/server/default/deploy/pentaho-style.war/images (nice catch in comments below)
  3. Drop flash_chart_example_bar.xaction and flash_chart_example.xaction into pentaho-solutions/samples/charts

That should you get two the sample bar chart and the sample pie chart working.

These action sequences are kind of fancy. They do a fair bit of string replacements, result set walking, etc. So, they aren’t for the casual user but if you’ve done some Pentaho stuff before you’ll be able to work your way through it.

The interesting part is really the “datacall=true” branch. The first time the action sequence is called it returns a fragment of code that contains the flash object.

<object classid=”clsid:d27cdb6e-ae6d-11cf-96b8-444553540000″ codebase=”http://fpdownload.macromedia.com/pub/shockwave/cabs/flash/swflash.cab#version=8,0,0,0″ width=”600″ height=”500″ id=”graph-2″ align=”middle”><param name=”allowScriptAccess” value=”sameDomain” /> <param name=”movie” value=”/pentaho-style/images/open-flash-chart.swf?width=600&height=500&data=http%3A//localhost%3A8080/pentaho/ViewAction%3Fsolution%3Dsamples%26path%3Dcharts%26action%3Dflash_chart_example_bar.xaction%26datacall%3Dtrue” /> <param name=”quality” value=”high” /><param name=”bgcolor” value=”#FFFFFF” /> <embed src=”/pentaho-style/images/open-flash-chart.swf?width=600&height=500&data=http%3A//localhost%3A8080/pentaho/ViewAction%3Fsolution%3Dsamples%26path%3Dcharts%26action%3Dflash_chart_example_bar.xaction%26datacall%3Dtrue” quality=”high” bgcolor=”#FFFFFF” width=”600″ height=”500″ name=”open-flash-chart” align=”middle” allowScriptAccess=”sameDomain” type=”application/x-shockwave-flash” pluginspage=”http://www.macromedia.com/go/getflashplayer” /> </object>

In this fragment, the flash object is given a “datafile” location which is the same action sequence but with a datacall=true.

The datacall=”true” basically returns a text file that looks like this:

&y_min=0& &y_max=40000000& &y_steps=4& &title=Actual vs Budget by Region,{font-size:20px; color: #bcd6ff; margin:10px; background-color: #5E83BF; padding: 5px 15px 5px 15px;}& &y_legend=USD,12,#736AFF& &x_labels=Central,Eastern,Southern,Western& &x_axis_colour=#909090& &x_grid_colour=#D2D2FB& &y_axis_colour=#909090& &y_grid_colour=#D2D2FB& &bar_glass=55,#D54C78,#C31812,Actuals,12& &values=37893162,35248940,35248940,35248940& &bar_glass_2=55,#5E83BF,#424581,Budget,12& &values_2=38397600,35487861,34803861,34510067&

This text file is really what gives the flash chart it’s form, labels, and data.

Again, this is quick and dirty implementation but it’s a life saver if you need something more than the charting in the platform.

Pentaho Fat Clients: Breaking into Double Digits

Business Intelligence is a complex diverse space. There’s a bunch of technologies that typically need to be combined together to get a comprehensive, end to end solution.

One of the things that I believe is confusing for users of Pentaho is the sheer volume of clients that are available to “quickly and easily” build your solution. The quickly and easily is predicated on the fact that if you need to build a “prompt” for a report, you know which of the fat clients to fire up. Want to dynamically hide a field? In order to do that you have to know that’s in a different fat client.

I know of at least 10 different good ole fashioned, download and install to your desktop clients that you’d use if you were doing a full, soup to nuts everything used Pentaho installation.

  • Design Studio
  • Report Designer
  • Report Design Wizard
  • Mondrian Workbench
  • Pentaho Metadata Editor
  • Spoon (Kettle)
  • Cube Designer
  • Weka Explorer
  • Weka Experimenter
  • <<new fat client Pentaho hasn’t announced yet>>

This is no easy challenge to solve for Pentaho. Part of the open source mantra includes making each of the individual projects (Kettle/Mondrian/Weka/etc) useful on their own, without some big Pentaho installation. What that means is a challenge to make a UI/designer/etc that works “standalone” but could also be included in some master development environment? That’s tough, and to date Pentaho has made only modest steps at this (Wizard inside of Designer).

I have no good advice for Pentaho in this regard. There’s a very good reason for keeping them as separate installations and I think it shows respect to the individual communities. However, this is an issue for people coming to Pentaho as a full BI suite. Does anyone have any good ideas on how to solve this pickle of a problem? We should all help Pentaho with this as it benefits everyone to come up with a good way to approach the development tools (as a suite and as individual products).

PS – My $HOME/dev/pentaho directory is littered with old installations. Every time Pentaho goes from 1.6.0 GA to 1.6.1 GA the only way to ensure you’re getting the correctly matched versions is to upgrade all those clients.

Beautiful Flash Charts for Pentaho

I’ve worked on several customer dashboards and found the charting in Pentaho to be pretty good in a lot of circumstances, but lacking for a lot of circumstances. In particular, certain shading, animations, etc aren’t supported in Pentaho charts (based on JFreeChart).

There are a bunch of Flash charting libraries, and I recently worked with a customer that was using “Open Flash Charts.” I helped them get Mondrian data streaming through to this flash charting engine. I was surprised to find that the library is open source, and is moving to LGPL (away from GPL) to ensure that people feel comfortable embedding it in their applications.

I started integrating these charting capabilities with Pentaho to see how the charts look. I was seeing some really great results. The integration was done via a fair amount of fancy Javascript/Xaction sequence stuff but this integration did not require any custom Java application work. Just Pentaho .xactions and the basic open-flash-chart.swf. I might start looking at building a small little JSP library to help with some of this.

The first one I built was a little pie chart, that has a nice animation (copied and pasted here without the dynamic .xaction stuff)

The second one I built was this beautiful bar chart, comparing actuals and budgets.

In all cases, if you’re needing some “more” from Pentaho in terms of data visualization, don’t hesitate to be in touch. This flash chart is the latest in a series of dashboards that Bayon has been building for customers.

UPDATE: I built another one for a new customer, and changed the data labels for presentation here. Having a grand time with open flash chart. This chart below is the output of an MDX query to Mondrian. The one is the metric ( a base measure ) the other is a running total.

Pentaho goes GPL: A non-event

Pentaho announced last week that their BI Platform version 2.x and onward would be released under the GPLv2 license. I’m an outspoken critic of GPL for a lot of use cases, and personally lean toward an Apache/MIT/BSD myself. However, for nearly everyone involved in Pentaho this is a non event, not that big of a deal, and good for Pentaho.

By now, if you’ve ever read anything I’ve written before about GPL for “business-eee” type projects you’re probably wondering “Has Nicholas completely sold out?” Well, I’ll leave that conclusion for another venue/time, wink wink, but there’s some very clear reasons why GPL is not a bad thing for most people involved in Pentaho.

First and foremost, is to understand what is moving to GPL. That makes a huge difference in understanding the impact. It is only the BI Platform technologies that are going GPL and the core libraries (Reporting, Kettle, Mondrian, …) are remaining under their original (ie, somewhat permissive) licensing. The things that are being GPL’ed are the things that end users are using. For instance, the ability to navigate through a set of reports. Run reports with parameters, etc. This is the code that makes the Pentaho core technologies (OLAP/ETL/Reporting) look and feel like a full product with login screens, UIs, run scheduling, etc.

The other piece to mention is that GPL only really affects ISV/OEMs.

For end users (even SaaS providers) it makes no difference GPLv2 vs MPL. So, if you’re considering downloading Pentaho to start a project at your company for your own intranet, extranet, BI, dashboards, etc this will have NO affect on you.

One of my beefs with the GPL has always been that it stunts adoption and the ability for multiple parties to work on the project, embed and utilize it in a commercial venture. The core libraries remain in tact in this regard – Mondrian can be embedded just as easily as it was originally because it’s license remains unaffected. Kettle can as well (LGPL). Pentaho Reporting – good to go too. The Platform as a set of UI (and productized versions of the core libraries) will be, in my opinion, cast aside for anyone wanting to embed these technologies into their own product.

The license will now be a big contributor to this decision, but to be truthful, if you want to “just use” Mondrian then you’re BETTER OFF by “just using” Mondrian. If you want Mondrian in conjunction with Reporting now you’ll want to consider the Platform but my experience shows that if you’re using these technologies in your application using the core applications/interfaces is preferable. The platform makes the projects work for end customers, but the platform is kind of “a lot” for someone who just wants to execute some ETL jobs or use JPivot/Mondrian in their application. That’s not to say that ISV/OEMs shouldn’t reach out to Pentaho to still get OEM support on embedding “just Mondrian” into their application. Pentaho’s subscription and services are quite valuable in this regard – I can think of no better group of people to help make a project successful then the people who wrote it.

It’s not clear to me whether or not Pentaho Metadata will be GPL. When I was working at Pentaho I advocated strongly against GPL for it, because I believed that done correctly the project could become *the* metadata editor/infrastructure for just about any new Open Source or proprietary project. For a variety of reasons, this hasn’t happened. GPL, in my opinion, ensures that Pentaho’s Metadata project will remain solely and simply that: Pentahos Metadata project. I don’t think they’ll be any other salient, significant contributor if it goes GPL. However, it’s not a big loss to Pentaho since there has been hardly any (have there been any?) contributions to that project to date anyhow.

GPL, should it provide Pentaho more “protection” on the Platform code so that it can not be ISV/OEM’ed without payments, could end up benefitting most everyone. Why? Because should Pentaho feel like it’s able to monetize the open source edition consistently, there is less need to keep more in the professional edition. If GPL provides additional cover, I’d hope to see more code flying into the Open Source (GPL) edition of the product. However, I’ve not heard anything about this from Pentaho and only time will tell. 🙂

There you have it.

GPL makes pretty much no difference to end users, customers, SaaS providers, etc. It pretty much makes no difference to ISV/OEMs because they’ll want to embed the core libraries, not necessarily the entire platform. Pentaho remains a strong choice in every regard; customers are signing up in droves, the value is immense.

It is, for all intensive purposes, a non event.