We’ve just released a beta cut of the Software Quality Solution for Jira. This project, sponsored by Pentaho is a complete BI solution that reports on Jira issue data that runs on top of Pentaho.
Software Quality Reports for Jira is an analytic application; it provides classic slicing and dicing of issue data, along with helpful trend lines, custom reports, etc. Jira does a GREAT job at operational reporting (what is assigned to me) but isn’t setup to do adhoc, complex, time series and historical reporting. Things such as bug burndown, average days to close by product and priority, trend lines on bug balances, etc.
Here are some graphs that come “out” of the solution using the web based end user tool: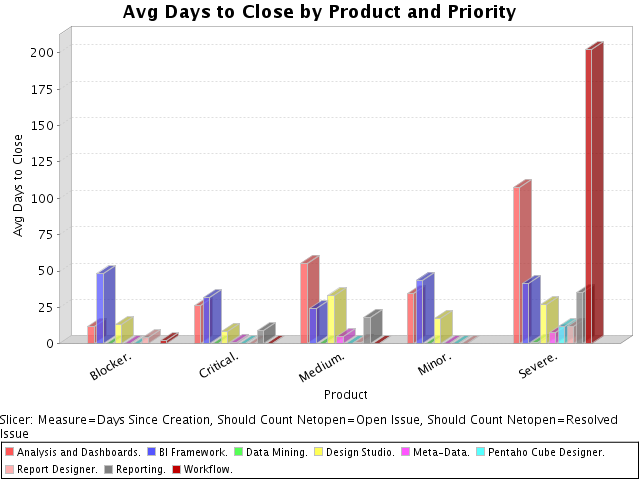
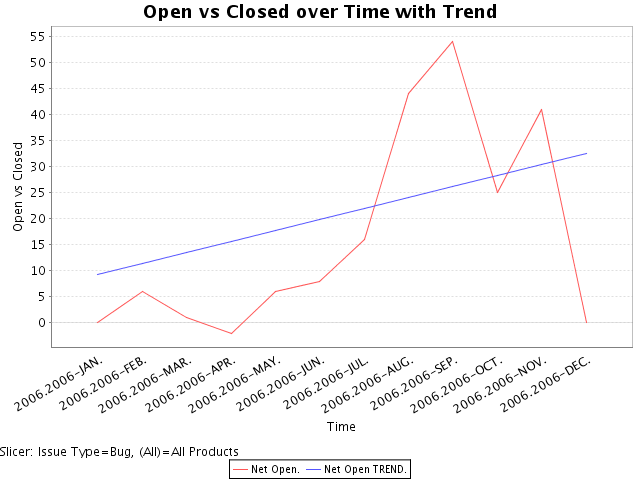
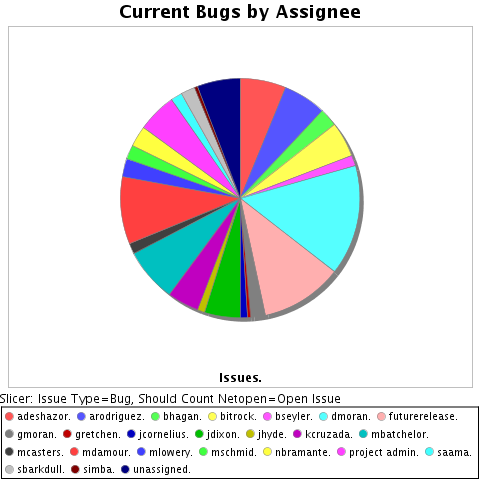
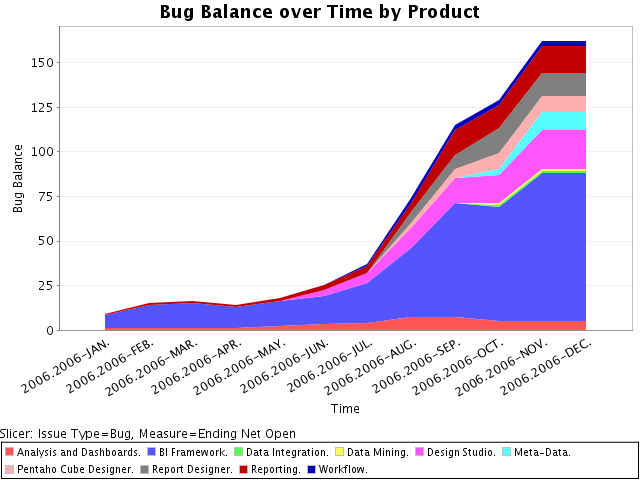
NOTE: These are reports built from the Jira installation Pentaho uses to track issues for our products, http://jira.pentaho.org:8080 a couple of days back.
This beta release is the first public release of the solution. We’ve had a customer using the solution, and we’ve been using it against our Jira data now for several months. In fact, we actually wrote the Jira build PRIOR to the Bugzilla build.
At this point, the primary goal is to collect feedback and set direction to make it more useful.
- What do you think? Is it useful?
- Is it worth the additional installation (Pentaho server) for reporting above and beyond reports in Jira?
- What do you want to see next? Dashboards, more reports, additional attributes on the Person dimension, etc?
Feedback here is fine, or email through to me ngoodman __ pentaho — ORG.
Hope you find it useful!