0.9.4 did not hit the 1 year mark!

Our last LucidDB release was now, just more than 12 months ago on June 16, 2010. We were really really trying to beat the 1 year mark for our 0.9.4 release but we just couldn’t. A tenet of good, open source development is early and often and we need to do better. Since the 0.9.3 release we’ve:

All in this is a VERY exciting release… I apologize it’s taken this long, but please bear with us. We’ll be release in the next couple of weeks!

SQL access to CouchDB views

Following up on my first post on an alternative, more SQL-eee metadata driven approach to doing BI on Big Data, I’d like to share an example on how we can enable easy reporting on top of BIg Data immediately for CouchDB users. We’re very keen on discussing with CouchDB/Hive/other Big Data users about their Ad Hoc and BI needs; please visit the forum thread about the connector.

We’ve been working with some new potential customers on how to leverage their investment in Big Data (specifically Big Couch provided by the fine folks at Cloudant. In particular, this prospects users are thrilled with their dashboards and analytics that are baked into their application, but they need to be able to enable Ad Hoc, easy analysis on top of their data via a traditional reporting tool. Like any organization, IT is overworked and reports always seem to find their way to close to the back of the priority. Our initiative at this customer is about enabling easy access to their high performance and well tuned/architected CouchDB instance.

I figured I could generalize what we’re doing at this prospect to a more general post, and hope that this post (and the software behind it, namely LucidDB) finds there way into the hands of others that are trying to do Ad Hoc and easy SQL based analytics on top of CouchDB.

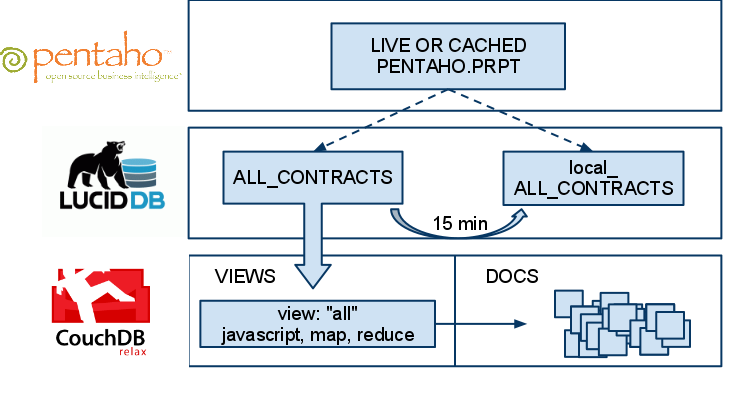
First, the overview:

HotorCold.png
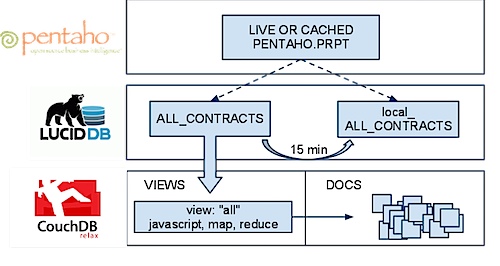
We’ve created a solution that allows HTTP views in CouchDB to be made accessible via SQL inside of LucidDB. This means two things:

  • Direct access to LIVE, real time data in CouchDB is available to any tool that can talk to LucidDB (SQL + JDBC/ODBC).
  • We can use this access to very easily, keep a cached up to date “cache” of this data in LucidDB, an optimized column storage database. In fact, the periodic refresh is a single MERGE statement (TO BE COVERED IN A SUBSEQUENT BLOG)

Our vision of Big Data BI requires that the user be able to “choose” which version of the data they want, easily. Cached and summarized inside LucidDB -OR- up to date, real time results from Big Data (aka CouchDB). This example focuses on the first part of the “hot or cold” level of aggregation ability; namely the live “HOT” piece.

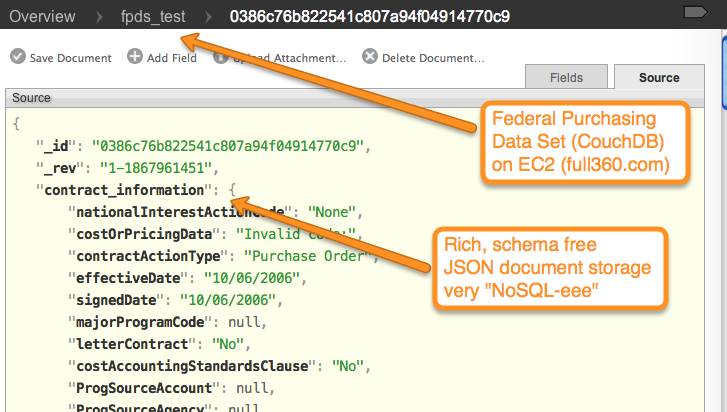
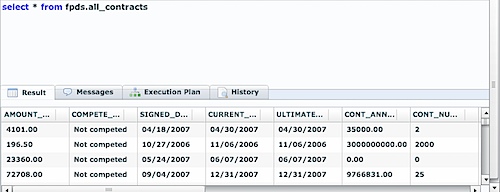
First, let’s look at our source data. We’ve used the Federal Purchasing Dataset (a sample of 1000 records, since this runs on my laptop). Here’s a couple of screenshots from Futon that show the source data docs, and then the CouchDB View.

201106091131.jpg

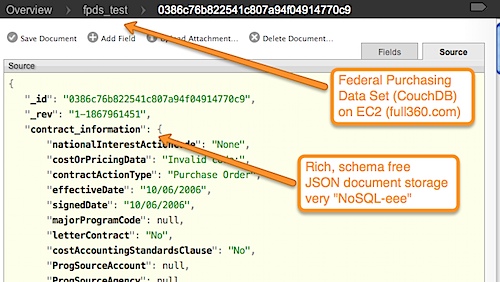
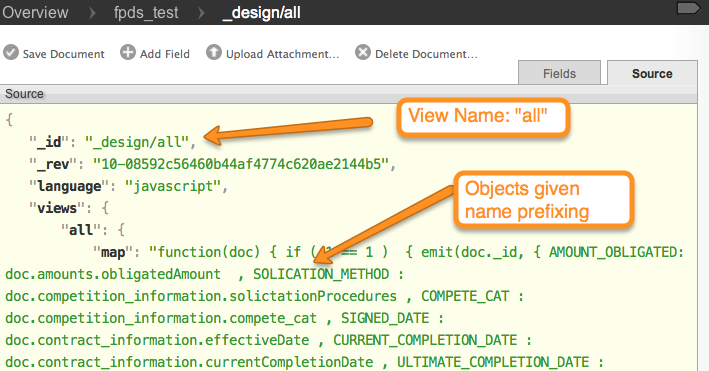
and also the “view” that we’ll access

201106091134.jpg

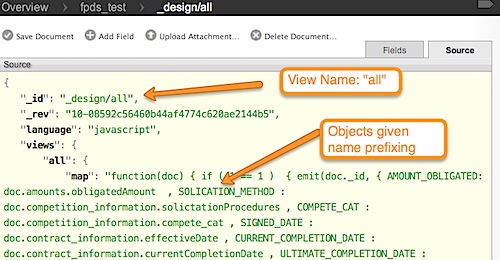
NOTE: This view is definitely atypical. It is just emitting docs/flattening. it is NOT doing any aggregation with is what is almost always done with HTTP views. Our connector initially supports streaming data from the values, but we’re already working on getting proper support for the KEYs (and ability to push down group_level, etc).

There’s another key piece of our philosophy on Big Data BI that is also present here. Notice that we’re not trying to “dumb down” the source, Big Data system? We’re not trying to strangely Map SQL onto some remote language so that you’ve lost some richness. CouchDB’ers take note: You can do all that you normally can and want to do in that view. We believe in effeciently accessing (group_level optimizations) not about reducing your abilities to write very interesting, complex map / reduce that returns your base level results.

Let’s make these available, via ANSI SQL, in LucidDB.

I’ll start with a vanilla installation of LucidDB (NOTE: I used a pre release version of 0.9.4 for this).

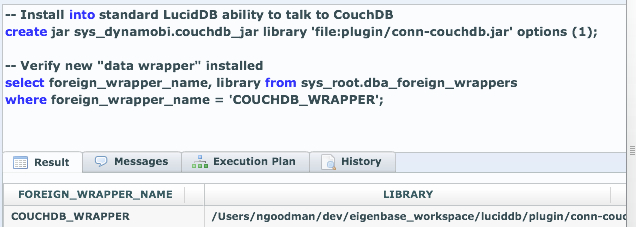
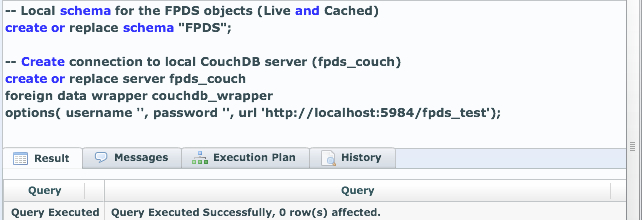
First, let’s give LucidDB the ability, in a general way, to talk to CouchDB as a foreign data source:

201106091212.jpg

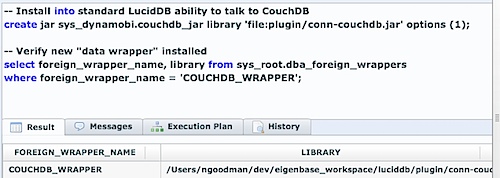
Now LucidDB has the ability to talk to CouchDB, in a general sense. Let’s now configure and access our test dataset.

First step is to create a server connection from LucidDB to our CouchDB server:

201106091215.jpg

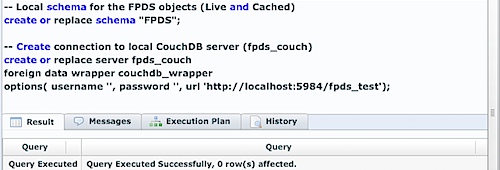
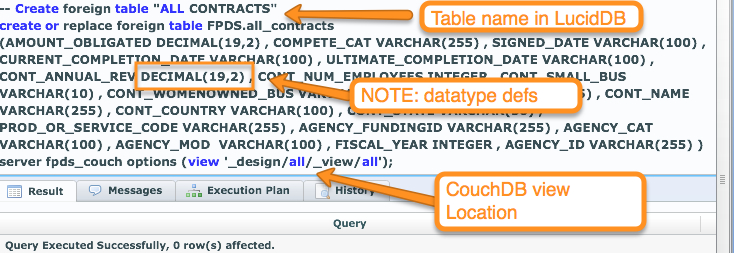
Now, we’ve established a connection from our LucidDB installation to CouchDB; let’s now make that “all” view available via SQL.

201106091232.jpg

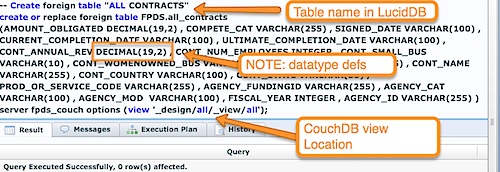
That statement looks complicated. It is, unfortunately, a little more involved than this process usually is. If you were talking to say, Oracle database, we can import and “discover” all this information (datatypes, column names, etc) from the driver. We have not done all this additional metadata work for the CouchDB connector yet; or actually, how to get ALL this information from the remote view as well.

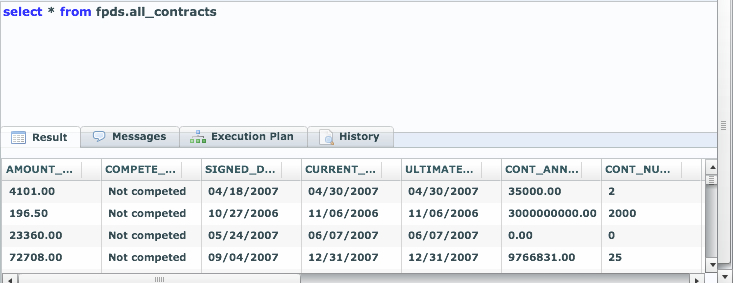
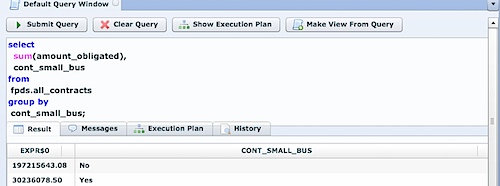
So, we’ve told LucidDB about the server, the view, the datatypes/fields. We’re all set to now do ANY SQL we like on top of it.

201106091237.jpg

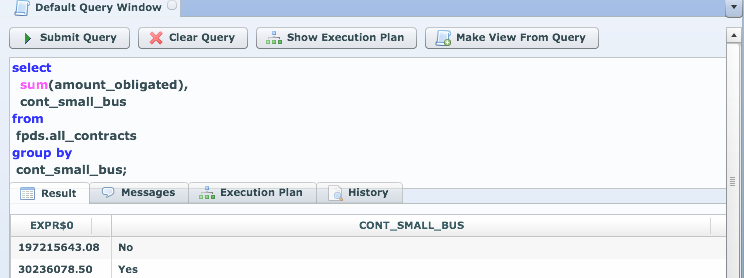
How about doing some aggregations?

201106091253.jpg

We’ll cover creating the “local” cached copy of the CouchDB dataset in the next section.

A different vision for the value of Big Data

UPDATE: Think we’re right? Think we’re wrong? Desperate to figure out a more elegant solution to self service BI on top of CouchDB, Hive, etc? Get in touch, and please let us know!

There’s a ton of swirling about Hadoop, Big Data, and NoSQL. In short, these systems have relaxed the relational model into schema(less/minimal) to do a few things:

  • Achieve massive scalability, resiliency and redundancy on commodity hardware for data processing
  • Allow for flexible evolution and disparity in content of data, at scale, over time
  • Process semi-structured data and algorithms on these (token frequencies, social graphs, etc)
  • Provide analytics and insights into customer behaviors using an exploding amount of data now available about customers (application reports, web logs, social networks, etc)

I won’t spend that much more time delving into the specifics of all the reasons that people are going so ape-sh*t over Big Data.

Big Data has a secret though:

It’s just a bunch of technology that propeller heads (I am one myself) sling code with that crunch data to get data into custom built reporting type applications. Unlike SQL databases, they’re NOT ACCESSIBLE to analysts, and reporting tools for easy report authoring and for businesses to quickly and easily write reports.

Until businesses get to ACTUALLY USE Big Data systems (and not via proxy built IT applications) it’s value to the business will be minimal. When businesses get to use Big Data systems directly; there will be dramatic benefit to the business in terms of timeliness, decision making, and insights.

And don’t get me wrong, there’s HUGE value in what these systems can do for APPLICATION developers. Sure sure sure. There’s Hive, and Pig, and all these other pieces but here’s the deal: Not a single set of technology has assembled, from start the finish, the single system needed to quickly and easily build reports on top of these Big Data systems.

It’s starting to get real confusing since vendors see Hadoop/Big Data exactly how they want you to see it:

  • If you’re a BI vendor, it’s a new datasource that people can write apps and stream data into your reports.
  • If you’re an ETL vendor, it’s a new datasource and you’ll simply make it practical.
  • If you’re an EII vendor, it’s a new target for federating queries.
  • If you’re an analytic DB vendor, it’s an extension point to do semi-structured or massive log processing.

We have a different vision for doing BI on Big Data; it’s different than the “our product now works with Big Data too” you’ve been told from other vendors:

  • Metadata matters: Build a single location/catalog for it!
    Where did this report on my dashboard actually come from? When I see this thing called “Average Bid Amount” on my report, which fields back in my NoSQL datastore was that calculated from? Why bother with a separate OLAP modeling tool when you already know your aggregation methods and data types. Current solutions where “it’s just another source” of data that shove summarized Big Data into MySQL databases for reporting miss a huge opportunity for data lineage, management, and understanding.
  • Summary levels require different “types” of data storage and access
    The total number of events can be represented and aggregated to many many different levels of aggregation. Some, very highly summarized figures (such as daily event counts) should be kept in memory and accessible extremely fast for dashboards. Relatively summarized figures (10s of thousands) should be kept in a database. Datamarts (star schemas) that represent some first or second level of aggregation (100m rows) should be kept in a fast column store database. The detail transaction data, and its core processing technologies (M/R, graph analytics, etc) are in the Big Data system. Current solutions provide only tools for data slinging between these levels of aggregation; none provide the ability to access and manage them in a single system.
  • Inexpensive BI tools allow for cheaper, quicker and better analytic solution development
    The “Business Intelligence” industry has been driving the application developer out of the required chain of events for building dashboards/analytic for years. In short, BI is a huge win for companies because it’s cheaper, helps get insights faster, and ultimately allows analysts to be somewhat self sufficient to do their job. Big Data has taken the industry back 10-15 years by making not just complicated reports but literally EVERY report be built by a developer! Current solutions allow for direct connect in reports to Big Data systems but you still have to write programs to access the data. Other solutions simply pull data out of Big Data systems and shove it at MySQL because of this exact reason!
  • SQL is familiar, well known, and matches with the “easy” data analytics
    How easy is it to find and hire someone who can write SQL and build reports (in Crystal/Pentaho/Actuate/etc)? There are literally millions of people that can know SQL. Like it? Who knows. Know it, can use it? MILLIONS! How about hiring someone to build reports who knows the ins and outs of cluster management in Hadoop, knows how to write multi step programs and write application code to push that data into visualization components in the application? 10s of thousands, maybe. And 70% of them right now are in Silicon Valley. Trust me; these skills won’t spread outside of Silicon Valley in great numbers (or at least quickly).
  • Reporting Only data matters! Make it easy to access/integrate
    Simple reporting rollups (say categories of products/web pages, etc) have no place being “pushed” into the Big Data system. Having a system that is doing BI on top of Big Data needs a way to easily, in a metadata driven fashion, match up the Big Data with other reporting only data. Current solutions require complex ETL development and assemble it as part of that stream of data to shove at a MySQL database.
  • Hot or Cold reporting, let the user choose via SQL
    For dashboards the user is almost certainly willing to use the previous load (last hours) data instead of waiting 17minutes to run in the Big Data system. For Ad Hoc analysis reports need to be speed of thought; big data systems can do OK here, but on smaller datasets the best choice is a columnar, high performance BI database (ahem!). For small summaries, or consistently accessed datasets it should be stored in memory. Current solutions require someone building reports to KNOW where the data that they want is, and then connect to an entirely different system (with different query languages such as MDX, SQL, and M/R) to build a report.

We’re building a system, with LucidDB at the center, that is the most complete solution for doing real, day to day, full featured (adhoc, metadata, etc), inexpensive analytics on top of Big Data. Ok, Yawn to that. Since Hadoop and Big Data is hype-du-jour I don’t expect you to believe my bold statements. We’re releasing LucidDB 0.9.4 in the coming weeks, and this core database release will be the infrastructure for the new UI, extensions, and pieces of our solution.

In short DynamoBI’s Big Data solution provides:

  • Ability to use inexpensive, commodity BI tools on top of Big Data directly and cached (Pentaho, BIRT, etc). Connect with your existing BI/DW system (via JDBC/ODBC).
  • Ability to connect, and make accessible via SQL Big Data systems (currently Hive/HDFS, CouchDB)
  • Easily define and schedule incremental updates of local, fast column store caches of data from Big Data systems for Ad Hoc analysis
  • Ability to quickly link and include data from other places (Flat File, JDBC, Salesforce, Freebase, etc) with Big Data
  • Define aggregations, rollups, and reporting metadata (hierarchies, aggregations, etc)
  • Drag and drop reports (via Saiku, Pentaho Analyzer, BIRT)
  • Easy, RESTful interaction with the server so our solution fits nicely with your existing systems.

Looking forward to blogging more about it in the coming weeks; if you’re sick and tired of hacking together and spending tons of developer time on building reports on top of Big Data systems please get in touch with us.

Why OLAP4J 1.0 matters

Julian Hyde and his cohorts on the Mondrian project have been busy at work for nearly 5 years (spec 0.5 done in 2006!) working on the difficult, but worthwhile effort of standardizing client side access to OLAP in Java.

They just released version 1.0! This is a big deal; bigger players have attempted and failed at this before (ahem JOLAP).  Kudos to Julian, Luc and the others involved to get such a *real* standard in place!

There’s a few reasons why this matters to everyone in Business Intelligence.  Not just Java devs and Open Source BI fans.

  • Only existing “de facto” standards are owned by MSFT

    XML/A was touted as **the** industry standard for OLAP client server communications.  You can think of XML/A as the SOAP equivalent of OLAP client libraries.  There are a few problems with this.First is that MSFT always treated this like they do all “open” standards; just open enough to get what they need out of it (SQUASH JOLAP) but never really open.     For instance, reading the spec, notice that the companies involved specifically note that they all absolutely reserve the right to enforce their patent rights on their technology, EVEN IF it’s part of the spec.  ie, it’s open, but if you actually IMPLEMENT it you might have to pay MSFT for it.

    Second is that XML/A is now a fragmented standard.  Similar to SQL, MDX support and other line protocol extensions (ahem, Binary Secured XML/A) means that there’s no one really making any sort of technology toolkit, collection of drivers, etc.  Simba does much of this in their lab in Vancouver, but they’re the exact opposite of open.  In fact, when the XML/A council vanished they pounced and picked up the site which is now a simple shill for their products.  A couple of guys at a single company without any open publication on variations in MDX/implementations is counterproductive to real interoperability.

    Third is that SOAP is soooooo 1999.  SOAP is fundamental in XML/A and there are many interesting (Saiku) ways of serving client server.  REST, direct sockets, in memory, etc.

  • Helps keep Mondrian from being fused to Pentaho Analyzer

    Mondrian is a very successful open source project and serves as the basis (server part) of Pentaho’s Analyzer (acquired from LucidEra).  Pentaho has clearly signaled their (lack of) commitment to upkeep of their open source frontends; Analyzer is proprietary software that Pentaho has committed all their OLAP UI efforts behind, leaving the community with an aging JPivot front end to Mondrian.  Clearly underestimating what the community has to offer, the community has delivered a replacement project Saiku to address this.

    OFF TOPIC: I’ve made several Open Source BI predictions and with the exception of Pentaho Sreadsheet Services (which technically wasn’t OSS) I’ve been right every time.  Here’s one for ya: Saiku will outshine Analyzer in the next 18mos and both technologies will be worse off because Pentaho, ironically and increasingly, chose proprietary instead of community. Ahhh… I feel better having said it.

    Keeping Mondrians primary exterior API as a standard helps ensure that Mondrian can not be subsumed (entirely) by Pentaho and that innovation can continue with multiple community projects doing shiny UI work on top of Mondrian.

  • A single, pragmatically useful API enables binding to other languages as well (ie, non Java)

    Saiku, basing their open source RESTful server on top of OLAP4J has now enabled cool mashable OLAP access to not JUST Mondrian (which was already available via SOAP/.xactions) but anyone else who creates a driver (SAP, SSAS, etc).  By actually having a real project that can collect up a real open driver implementation with a few implementations means that projects like Saiku (which actually has client APIs for C, Obj-C, Ruby, ActionScript, etc).

    I wouldn’t be surprised if there are others layers (ADOMD?) that leverage OLAP4J as well.

Java OLAP nerds unite!  Non Java nerds checkout Saiku.  Pentaho users/customers know that OLAP4J is good for keeping Mondrian open and innovative.  OLAP innovation is alive and well, led by Mondrian, Saiku, Pentaho, etc.  Happy MDX’ing.

Column Store 101

I’m often asked, as an initial question of why LucidDB can perform so much better than traditional row store databases like Oracle, SQLServer, DB2, MySQL is HOW?

There’s a bunch of reasons and we have entire sections of our Wiki dedicated to the topic, but first and foremost is corner stone of almost every analytic database.  We’ve changed the way we orient the data on disk.  I’m not going to go into too much detail here, but I think as a start, a very simple example can help gain a little more understanding about how we can deliver an order of magnitude better performance over a row store.  More to come, as well.

Take the following query that is typical of BI workloads (we’re using commercial flight data available from the BTS):

select count(Carrier), Carrier, DayOfWeek, CancellationCode
group by Carrier, DayOfWeek, Cancellation

This query is typical – we want some aggregation (count of flights) grouped by several qualifying attributes (Carrier, DayOfWeek, CancellationCode).  We need to examine (in our example dataset) approximately 63 million records to answer this question.  In other words, we’re looking at all the data in a table to answer the query.

In a row store, even with indexes, a query that needs all the data from the database needs to touch all the data in the table.  This means THE ENTIRE TABLE is accessed from an I/O perspective.  Even though only a few columns or bits of data might be used, the ENTIRE row (that contains all the column data) is accessed off disk.

Let’s take our 63 million record table, that has approximately 99 columns.  Assuming (and this is bad assumption) that the row store takes the exact same amount of storage as a column store, the total table size is 3,025 MB.  In the row store, the data stored in rows is stored in blocks and is relatively uniform (ie, approximately 1000 rows / blocks and stored in 63,000 blocks).  In a column store, we store the columns separately.  Our storage for the same 3,025 MB breaks down like this (total is still 3,025 MB).

NOTE: Sorry for the graph labels! Sort of jumbled!

As you can see, some columns still continue to take up a fair amount of space (120MB +) but other columns are much much smaller.  The smaller columns are ones where values are repeated often (Year, Carrier, etc).

Here’s the gist.  Remember our SQL query typical in BI systems?

select count(Carrier), Carrier, DayOfWeek, CancellationCode group by Carrier, DayOfWeek, Cancellation

The SQL statement only access 3 columns (Carrier, DayOfWeek, CancellationCode).

In a Row Store, the database has to read the ENTIRE table from disk (3025 MB)

In a Column Store, the database only reads the columns it needs from disk (44 MB)

The column store is doing almost 1/100th of the work of the row store!  44 MB vs 3025 MB!

It isn’t magic.  It isn’t some magical breakthrough in CPU technology.

We’ve simply changed how we’re storing the data on disk so that asking the same question (SQL) on the same data (63 million rows) does far less work (44 MB vs 3025 MB) to give the same answer.

I’ll follow up with more on the this and other topics, but I hope this helps explain a very very basic reason of how LucidDB can deliver such fantastic improvements over otherwise very well performing OLTP databases like Oracle.

LucidDB has a new Logo/Mascot

At yesterdays Eigenbase Developer Meetup at SQLstream‘s offices in San Francisco we arrived at a new logo for LucidDB.  DynamoBI is thrilled to have supported and funded the design contest to arrive at our new mascot.  Over the coming months you’ll see the logo make it’s way out to the existing luciddb.org sites, wiki sites, etc.  I’m really happy to have a logo that matches the nature of our database – BAD ASS!

SaaS or On Site? Who cares with Pentaho On Demand

Pentaho launched their On Demand initiative today: Press Release.

While the launch is new, I know that Pentaho has already onboarded some customers in a quiet soft launch and the response has been very positive.  Why wouldn’t it be?  This offering is the best of both worlds, and makes purchasing a business department driven BI project easy.

SaaS BI’s key selling point (there are many small, nice to haves, but the thing that gets people to reach for their wallet) is the ability to get a solution with an almost total lack of IT involvement.  Throw in non cap-ex expenditures for the solution (4k USD / mo instead of a 30k license) and it’s a huge win.

Business users have their data (feeds, dumps, extracts, or connections to DBs), have the budget but then need the tools/expertise to get their BI system “up and running.”  SaaS and On Demand BI is a perfect fit for these customers – up and running quickly.  Where it breaks down, is that with a SaaS offering, once you go SaaS you can’t EVER go back.  You’re stuck with a solution built entirely upon a proprietary, vendor controlled software and infrastructure.

Recap:

Biggest draw of SaaS is quick easy startup without IT, and smaller monthly pay as you go
Biggest drawback of SaaS is lock in like you’ve never seen before.  Not just software, but operations as well.

That’s why I find the Pentaho On Demand BI initiative to hit the middle of the sweet (suite?) spot.  It is absolutely the best of both worlds.

Their On Demand offering allows

  • Business sponsors to get a complete BI suite up and running quickly (72 hr challenge is wicked cool) without IT involvement (or minimal).
  • Incremental, pay as you go billing.  This is huge – not sure your BI project will generate a return?  Spin up Pentaho On Demand, do the 72 hr challenge, and shop it around the demo to the users for a month or two.
  • This is what knocks it out of the park though; Once you’re done with your eval/build out you have so many options whereas with pure SaaS you don’t.  Not what the users wanted? No problem: throw it away.  Is what they want?  Keep going On Demand?  On Demand not something your IT likes -> bring it On Site.  That’s right, Pentaho and their hosting partners have designed their On Demand offering to permit shutdown and transport of the machine VMWare images in house.  Even without that, just getting your Pentaho Solution you can install Pentaho locally and run it in house with your reports/cubes/dashboards.

On Demand BI won’t be for everyone – it’s still geared towards people wanting a complete suite of BI tools, and are willing to pay for a private, secure Pentaho instance in the cloud.  SaaS BI will still be better for people who actually prefer ZERO infrastructure and for those that don’t have the budget for a private infrastructure (if you have $100 / mo for BI, this isn’t right for you).

Great news for “frustrated with IT but still wanting to build out a real, long term BI solution” analysts everywhere.  🙂

Encrypt PDI passwords

PDI has a basic obfuscation method for making it difficult for casual people to lift passwords for DB connections. I have customers that maintain different versions of a “shared.xml” file that maintain different physical connections to databases (think development, QA/testing, and production).

In order to generate the different shared.xml, a user has to usually (per Matt Casters comment below there is a utility that allows user to do this outside of Spoon) open up PDI, created the connections, save them, and then sometimes copy and paste the sections needed to create their “dev” version of shared.xml or their “production” version of shared.xml. Many times this just to generate the password, as they can hand edit the other pieces (hostname, schema, etc).

I just committed a quick little PDI transformation that gives you the PDI encrypted form of a password.

201001291332

Happy Password Encrypting!

Asking this question means you don't get BI market

In almost every technology company, if you’re explaining your business model savvy technology executives ask the question:

Who are you selling this too?  What’s his/her title, where does he work?  What’s the size of their company?

It’s a question that helps the questioner understand, and the responder clarify exactly who is buying the product.  This is critical for a business!  Is it the System Administrator manager who is looking for his DBAs to coordinate their efforts (groupware for DBAs)?  Is it a CRM system that the business users are primarily evaluating for use (salesforce/sugarcrm) but requires huge IT investment for configuration/integration??  For a software or IT services provider, deciding WHO you sell to (Business Users or IT) is hugely important!

Asking this question when that technology or services is in Business Intelligence is just plain useless though. Business Intelligence is always a mix of the two.  IT?  Sometimes they’re the ones buying, but never without HUGE amounts of time spent with the business side (casual report developers and business analysts).  Business Users buying tableau, and coordinating parts of the purchase or data access with IT?  Yup.   Analysts embedded with business teams buying SAS/SPSS, through an IT purchasing process?  Sure thing.

Business Intelligence is always sold to two groups at once which makes it a tricky thing to sell.  Anyone reading this, consider how much tension you’ve observed between your IT/Business groups.  Trying to get dead in the middle on this is a tricky proposition.

Business Intelligence sales guy earn their money for sure!

DynamoDB: Time Dimension table with MERGE

So, even with my disclaimer note on the last blog, the DynamoDB developers slapped me around a bit for suggesting using a view for a Time Dimension. The Time Dimension is the most important dimension table and should be an actual table, not a view. Creating the table allows us to perform all kinds of optimizations like star joins, bitmap indexes on attributes, etc. Probably wouldn’t be that big of a deal for a tiny fact table (< 5million records) but you’ll want CREATE TABLE if you want good performance.

Good news is, that we can use our exact same table function (with fiscal year offset)

select * from table(applib.fiscal_time_dimension (2000, 1, 1, 2009, 12, 31, 3))

to populate and keep our Time Dimension TABLE up to date.

If you use a TABLE, it’s 2 steps:

  1. CREATE TABLE : “dim_time”
  2. POPULATE TABLE : “merge into dim_time”

We’ll be using another great tool in the DynamoDB / LucidDB toolkit, the MERGE statement. The MERGE statement is a logical UPSERT. It checks to see if key is already present. If it is, we UPDATE the table. If it isn’t, we INSERT it into the table. I’ll go into more detail at some point in the future as MERGE is crucial for keeping dimensions up to date.

Let’s create our Time Dimension table:

create table dim_time (
FISCAL_YEAR_END_DATE DATE
, FISCAL_YEAR_START_DATE DATE
... ABBREVIATED ...
, TIME_KEY DATE
, TIME_KEY_SEQ INTEGER
,constraint dim_time_pk primary key (day_from_julian));

NOTE: We’ve abbreviated the statements, but all the columns are used in the actual scripts. We also should add bitmap indexes on YR, MONTH, etc columns.

We’ve now got a TABLE that matches the VIEW we created in the previous blog. We’ve made day_from_julian as our PK, and we’ll use this date as our key for the MERGE statement. We can run this query as many times as we like and it will always just keep our “dim_time” table up to date.

merge into dim_time using (select * from
      table(applib.fiscal_time_dimension (2000, 1, 1, 2010, 12, 31, 3))) src
on dim_time.day_from_julian = src.day_from_julian
when matched then UPDATE set
FISCAL_YEAR_END_DATE=src.FISCAL_YEAR_END_DATE
,FISCAL_YEAR_START_DATE=src.FISCAL_YEAR_START_DATE
... ABBREVIATED ...
,TIME_KEY=src.TIME_KEY
,TIME_KEY_SEQ=src.TIME_KEY_SEQ
when not matched then INSERT
(FISCAL_YEAR_END_DATE
 , FISCAL_YEAR_START_DATE
... ABBREVIATED ...
 , TIME_KEY
 , TIME_KEY_SEQ)
values(
src.FISCAL_YEAR_END_DATE
 , src.FISCAL_YEAR_START_DATE
... ABBREVIATED ...
 , src.TIME_KEY
 , src.TIME_KEY_SEQ);