Ok, well maybe not 60 seconds but more like 5 minutes.
Some great news today from Pentaho. Pentaho has purchased proprietary software for visually building reports and donated it to the open source community. The full text of the announcement is here:
More on this in a later post… Let’s get to the bits.
Much of what I’ve been hearing in the marketplace is the perception that Open Source has hidden costs in terms of usability and the technical savvy needed of users.
Let us try and challenge this assumption and see how "productive" we can be building a simple database driven report.
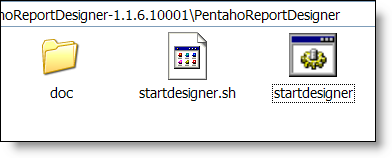
Download the Report Designer here and unzip it to a directory of your choosing. There’s zero installation required (you’ll need Java on your computer, but that’s pretty prevalent these days). Double click on the bat file (or .sh if you’re using linux).
When the product launches you’ll notice a panel that allows you drag and drop elements onto the canvas in an easy to use fashion. I’m sure additional tutorials will come on this blog and Pentaho.org but suffice to say, this is an interface which is easy enough to just "figure out" by playing with it.

The "RED" circle is our palette and the "BLUE" area is our canvas.
Let’s get going and start our report!
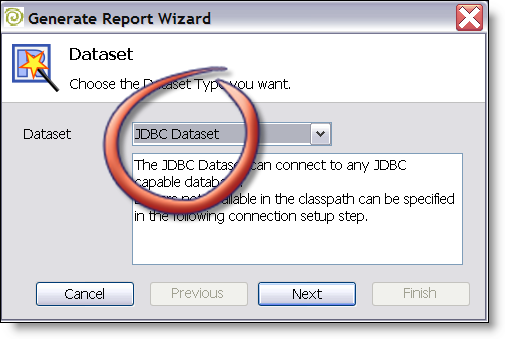
- Launch the Report Wizard

- Select the option that indicates that you will use your own dataset, a JDBC dataset
- Enter in the connection information and driver location for your database. I keep the latest Oracle Express edition (a Free version of the Oracle database) around.
Note: You don’t have to do anything special with the JDBC driver (put it in a lib directory or anything). All you have to do is show the wizard where the .jar file is.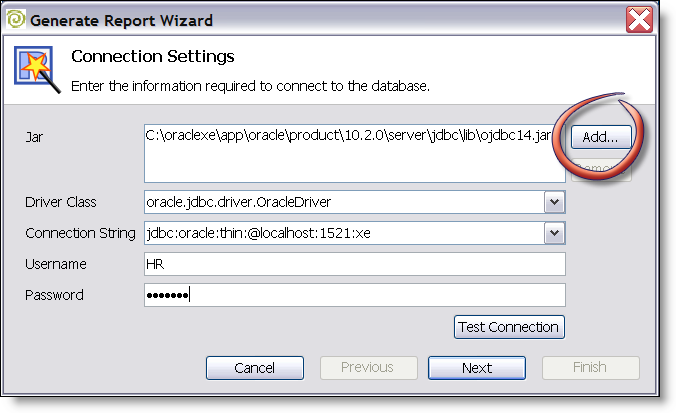
I’m using the HR schema which comes with the Oracle database for testing/sample purposes. - Navigate to find the "EMPLOYEES" and "DEPARTMENT" tables. Enter in a simple SQL query that contains the data of interest and use the very handy Preview Option to make sure you’re getting the results desired.
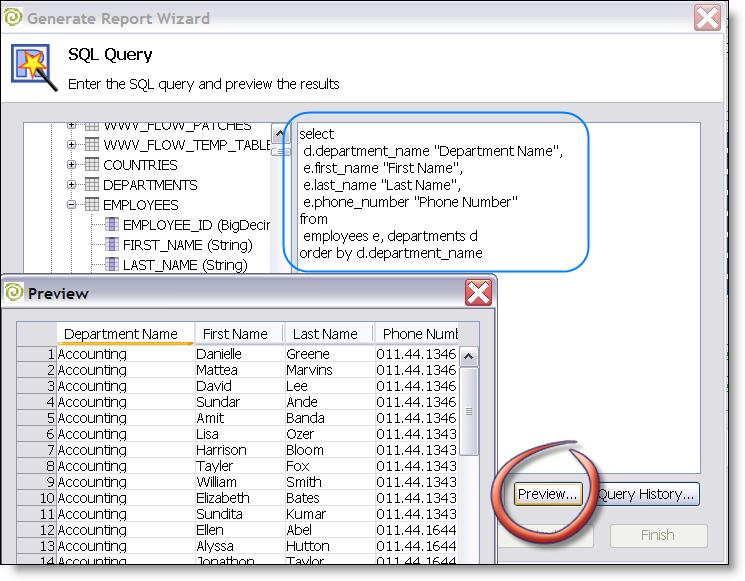
Feel free to just copy and paste if you are using XE as well:
select
d.department_name "Department Name",
e.first_name "First Name",
e.last_name "Last Name",
e.phone_number "Phone Number"
from
employees e, departments d
order by d.department_name - You can just click Next on the visible feilds screen:

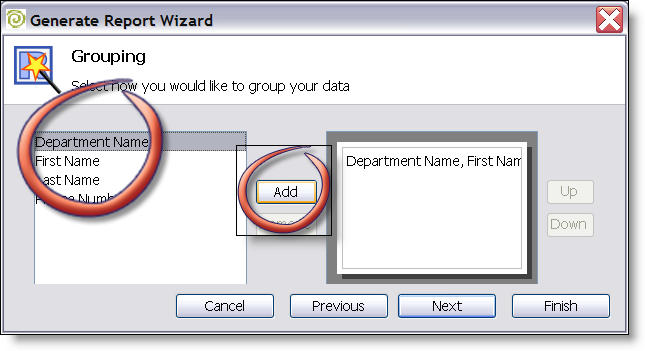
- Highlight "Department Name" and add it to the grouping and hit "Finish"
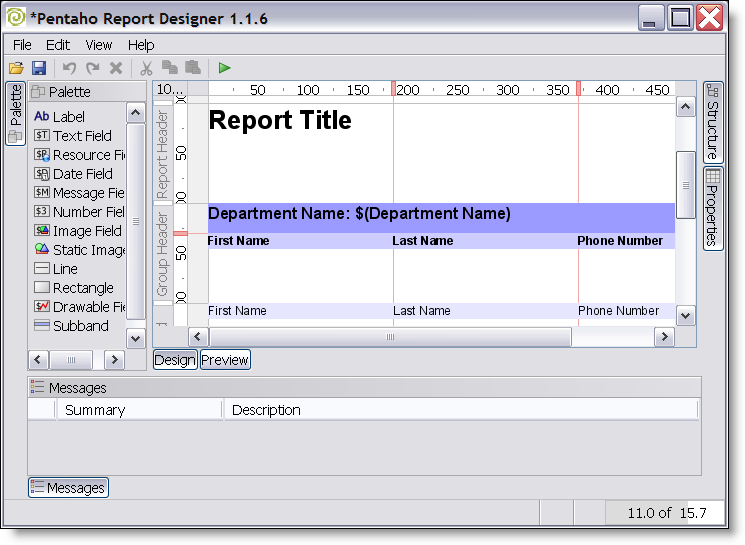
- It should return you to the original canvas where you can see the design of your report. From here you can start to add images, lines, change fonts, etc. Have fun exploring the richness of the options available here.
- Let’s see what it looks like! Click Preview and page through your report!
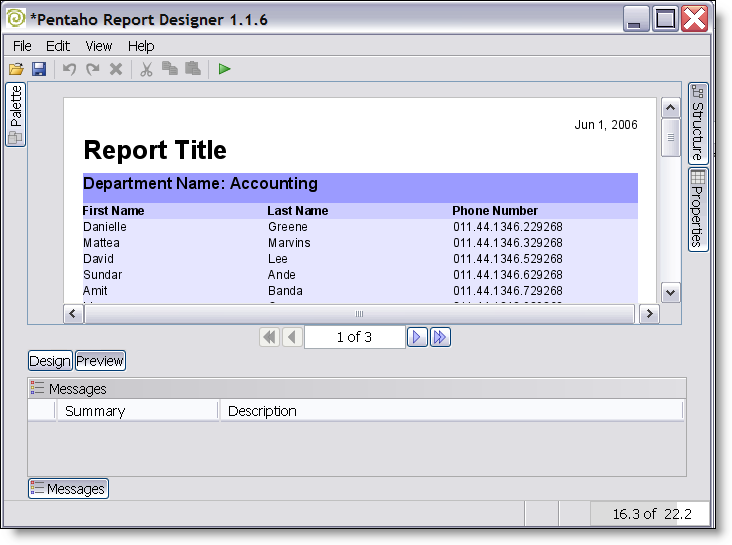
That’s it! You’re done! You’ve created a report that can be parameterized, hosted, bursted, distributed in just a few minutes. In a follow on blog I’ll show you how to publish this into the Pentaho server (it’s only about 2 more steps).
Happy Trails!
Hello Nicholas,
thank you for the screenshots which quickly give some impression.
Just to note: The Screenshot of step 5 does not display on my IExplorer, even not if reloading the page.
BR,
Martin
Vienna/Austria
Hi Nicholas,
I just installed and tried out the new Pentaho Report Designer and to be honest: I looks pretty much like BIRT 2.x to me – just with less functionality.
So why does Pentaho put effort in developing a “clone” of BIRT, if BIRT is already available and tested. And as I mentioned: BIRT 2.x already has a lot of more functions for creating Charts and complete Dashboard views.
I mean BIRT 1.x already run with Pentaho – so why not update this interface instead of developing a new GUI?
Sebastian and Martin,
Thanks for commenting!
re: Images, I just opened with Internet Explorer and it worked fine. Weird. I’ll keep an eye on that over time to see if there’s something diff about image posts from Firefox/IE.
re: the Pentaho Designer. I just recently joined and I’m not one of the product managers so I don’t know precisely how buying this product was decided upon. Let me share what I do know:
While Pentaho can schedule, parameterize, and burst Jasper and BIRT reports this is for customer choice; people like yourself are keen on BIRT. That’s great, we think we can add value for anyone who needs a “full BI solution” instead of just a reporting engine. I’m guessing that we will upgrade to 2.0 at some point (again, not in Engineering) and continue to support the BIRT reports for customers that choose it.
Our informal (we didn’t control variables, etc) testing and experience with integrating all THREE reports into the platform was that JFree was superior in a few key areas. Performance was significantly better in volume, the modularity/architecture was a benefit. Pentaho “acquired” JFree for several reasons but the least of which is probably the need for a great engine that really just needed some GUI, enhancements to be the top open source Reporting engine. I DO NOT want to assert that JFree is a better engine than Jasper or BIRT… They are both fine engines and we continue to offer them as a choice to our customers.
So, I suppose it’s a matter of investing in the reporting engine that will work easily and perform best inside of Pentaho. We could repackage BIRT Designer but that adds no value; community members are able to use it if they wish (of course, as soon as we’ve upgraded to 2.0).
I’ll pass along your request to upgrade to BIRT 2.0 in the platform; sounds like a good idea so I’m sure it’s just a priority thing.
Kind Regards,
Nick
I think the reason the image isn’t showing is that its pointing to a file on your computer rather than a web url.
file:///C:/Documents%20and%20Settings/ngoodman/My%20Documents/My%20Pictures/_blogimages/blog-%202006-%2001-%2016-%2009-%2011.png
Sebastian,
I checked with our engineering team and the BIRT 2.0 is on the roadmap and will likely (things change) be addressed in the next quarter or so. One of the benefits of open source is that you’re welcome to chart your own course if our course doesn’t suit you. If you need BIRT 2.0 urgently you’re welcome to implement it yourself. If so, my only advice is to “touch base” with Pentaho chief geek ahead of implementation — the Pentaho developers have deep experience in all three report engines so could offer good advice in that regard.
Happy Reporting!
Update: The guys on the ground tell me it’s closer to end of this month for BIRT 2.0… So look for it soon!
Thanks Nick for the quick update on that topic!
btw: very nice blog!
Nicholas,
That’s a great intro into the report designer. I ran acrost your experiences with pentaho training when I was trying to find out an easy way to make cross tab reports in pentaho so I poked around a bit on the site. I defently think that the designer will be an awesome addition to the pentaho SOA just like kettle was. And allowing the use of BIRT 2.0 will be great as well. Any idea what your next pentaho tip might be?
Thanks,
Nic
Nicholas,
Any chance you have an example on how to do a bar & line chart ?
I have tried all the combinations I could think of but the charts always come out blank.
I am trying to chart date/value or string/value pairs.
Thanks
Hello, Nicolas,
Thanks for the great blog.
I am looking for a tool that could generate reports from a warehouse, preferably with ‘drill up & down’ feature.
I would like to specify the dimmensions and facts tables, select the colums I am interested in and start drilling.
Can Pentaho do that?
Perhaps you know the tool, which is good for that?
Best regards,
Valdas
Chart howto needed
I agree with Nicholas about the charting. I was able to create a chart with the wizard, but I cannot with the report designer. I have looked for documentation and only found references to the wizard. Please leave a link or a howto on the process of creating and embedding charts with the report designer.
Thanks
Use BIRT and Jpivot to deploy complete BI
If I want to use Oracle with the PCI, can I do it?
thanks