Pentaho Analysis (aka Mondrian) is a powerful OLAP tool that can wrap just about any JDBC datasource and present it multidimensionally. There are many resources that cover how to get Mondrian connected to a database, some of the ins and outs of the the Mondrian.xml schema definition, etc. Comment below if you’re also interested in seeing a tutorial here in that regard.
Connecting from MDX to usefullness isn’t always the easiest… How powerful is MDX? Why would I do something in MDX versus SQL? Why not build another measure in my fact table to support that query instead of MDX? Well, I won’t belabor the benefits of MDX and the expressiveness of the language – there are plenty of great books and resources in that regard.
Suffice to say that it makes certain analytic queries (Year to Date, % contribution to total, this versus period prior) easy… sometimes embarrassingly easy compared to what we used to do in pure "star schema relational and SQL group by" land.
Let’s build a custom MDX measure and then in a followup I’ll show how provide this to your end users in Mondrian without this complexity.
- Download the latest pre configured installation (aka DEMO) of Pentaho here:
http://www.pentaho.org/download/latest.html - Unzip it into a directory on your local machine (we’ll refer to this as $PROOT from here on out).
- Double click on "$PROOT/pentaho-demo/start-pentaho.bat." When you see the message "Pentaho BI Platform Ready" the platform is ready, about 2 minutes.
- Open up firefox (or IE) and go to the following URL
http://localhost:8080, and then click on Samples and Examples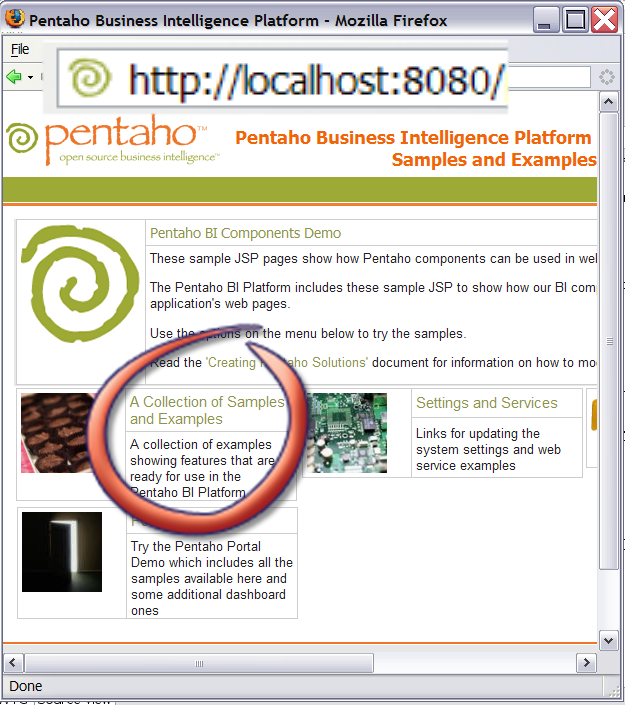
- Find Analysis examples, and click on that

and then click on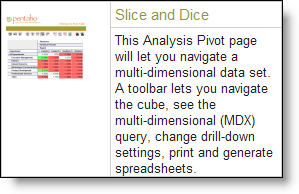
- You are now viewing the JPivot application that allows you to navigate and build OLAP reports in a web browser.
- (Optional Step) Feel free to explore the JPivot interface at your own leisure, a great place to start is the CUBE NAVIGATOR(
 ) which gives a pretty good graphical way of navigating OLAP cubes: Make changes, and then click on OK to make the crosstab report below change.
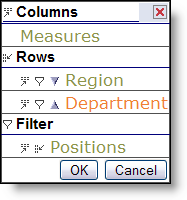
- Click on MDX to open up the MDX Editor Window
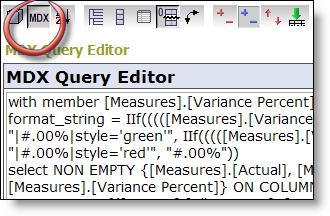
- Paste the following MDX into the text area and then hit APPLY:
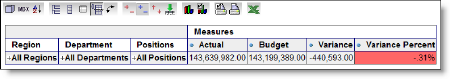
select NON EMPTY {[Measures].[Actual]} ON COLUMNS,
NON EMPTY Hierarchize(Union({[Positions].[All Positions]}, [Positions].[All Positions].Children)) ON ROWS
from [Quadrant Analysis]You should see the report look like this:

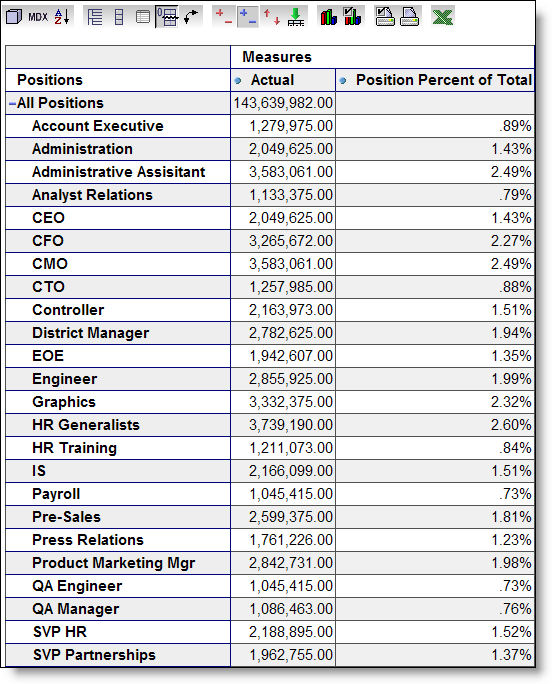
- What we’re seeing here is the rollup of all of our head count (ie, salary expenditures) by position. The aggregate figure is nice, for the bean counters, but of interest to the analyst and executives is the "that is that in proportion to my entire enterprise?" In other words, 1,211,073.00 on HR Training personnel is not as interesting as what % I spend on HR Training personnel as part of the total. Let’s open paste the following calculated member into the MDX window ABOVE the current MDX statement:
with member [Measures].[Position Percent of Total] as ‘([Measures].[Actual] / ([Measures].[Actual], [Positions].CurrentMember.Parent))’, format_string = "|#.00%|"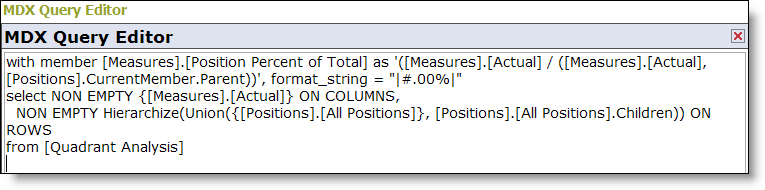
Click APPLY and then Close the MDX editor (red X or the MDX button again).What we’ve done here is built a calculated measure that using MDX. MDX is very powerful so I suggest you check out some MDX books or resources on the net to explore its capabilities.
- Now we need to add our brand new calculated measure to our report. Click on the cube navigator, then "Measures" then highlight the new Measure we just created:
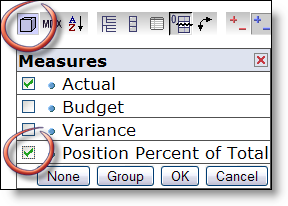
You have to click OK twice here to get back to the report. - If all has gone well, you should see the following report with your custom MDX measure:
Well, that’s great for the techies and hard core business analysts, but we’d never want to have to have an end user to have to figure all that out. How do we buffer the user from that complexity? That will be tomorrows blog entry on how to make a CalculatedMember in Mondrian.
Bonus Screenshot of a pie chart in two clicks now based on our percentage: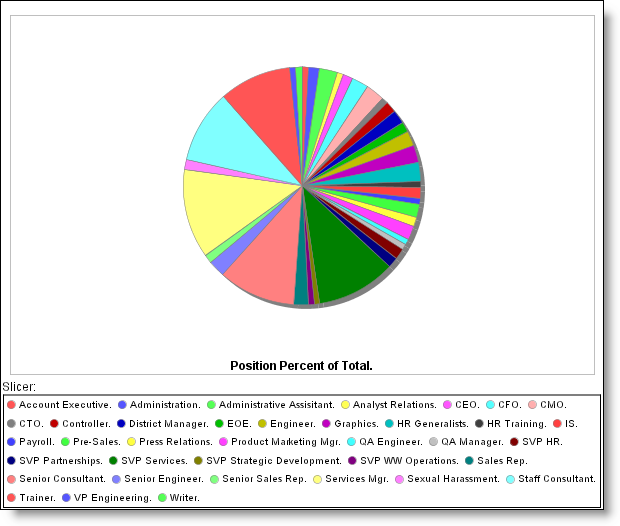
Nic, these are outstanding tutorials on Pentaho. I would definately like to see step by step instructions on setting up Mondrian with a database and building the schema definition.
Pingback: Nicholas Goodman on Business Intelligence » Blog Archive » Mondrian: OLAP power at your USERS fingertips
Hi Nic,
I would appreciate a tutorial on how to set up my own Mondrian datasource in Pentaho (apart from the query1.xaction in the Samples). I am having difficulty in trying to figure out how my SQL DB, the mondrian datasource and the .xaction are wired with each other!!
Thanks in advance.
– Nix
I, as well, could use the nuts and bolts of it – how do you take a jdbc connection to a datasource and set everything up so that it ends up at a Pentaho Analysis option? Trying to sort it out myself, but not getting that far. A step by step would be great!
It will be grate to have a connection library for RDBMS and OLAP sources that can be used with all Pentaho applications. For Example the Report Designer manages JDBC connections, in the case of connecting to SQL 2005 it lets you define a .jar file its classes and connection string. This cannot be achived using the ReportDesignerWizard or using the Pentaho Design Studio.
On the other hand, I would like to connect directly using XMLA directly to Analysis Services 2000, but I cannot find any examples.
Hi
It is interesting to know the technical ways of getting business intelligence.Why cannot you post a topic on human intelligence on search…..like many sites are there like google answers….you can post like what do you think of those…
Regards
Ragu Sivanmalai
http://ragusivanmalai.blogspot.com/
It would be nice to have documentation on how to dynamically build and load a cube….
Tip: make sure when you paste the second MDX statement that you remove the curly single quotes. They will break Pentaho. To remove, delete the slanted single quotes and replace with standard single quote.
I’m not quite understanding what all
this is supposed to be about?
Must be me or something…
Hi,
I’m new to this pentaho and the toools it’s using.I’m using cube generator to create cubes for pivot tables.But when i’m trying to add a dynamic column it’s not working.My database is in SQL.
Suppose there is a column ‘addddate’ in the groups table and I like to add dimensions like “year(adddate) as year” and a hirarchy “month(adddate) as month” in the cube.Can some body help me soon.