Pentaho Data Integration (aka Kettle) can be used for ETL but it can also be used in EII scenarios. For instance, you have a report that can be run from a customer service application that will allow the customer service agent to see the current issues/calls up to the minute (CRM database) but also give a strategic snapshot of the customer from the customer profitability and value data mart (data warehouse). You’d like to look a this on the same report that with data coming from two different systems with different Operating Systems and databases.
Kettle can make short work of this using the integration Pentaho provides and the ability to SLURP data from an ETL transform into a report without the need to persist to some temporary or staging table. The thing that Pentaho has NOT made short work of, is being able to use the visual report authoring tools (Report Designer and Report Design Wizard) to be able to use a Kettle transform as a source for the report during design time. That’s an important point worth repeating.
As of Pentaho 1.6, Pentaho provides EII functionality at RUNTIME but NOT at DESIGNTIME.
So, you can use an ETL transform as the source of a report, and there two examples of that. In the samples/etl directory that ships in the Pentaho BI Suite demo or you can see another example in an earlier blog entitled “Simple Chart from CSV“.
What is the best method for building reports that are going to use this functionality?
I, like others who use the Pentaho product suite, would like to use the Report Designer to build my report visually but have the data actually coming from an EII transformation. This blog is about those steps.
Step 1. Create your data set
Build an ETL transformation that ends with the data you want to get on your report. Use several databases, lookups, calculations, excel files, whatever you want. Just get your data ready (use the Preview functionality in Kettle). You’d do this with Kettle 2.5.x if you want to deploy into Pentaho 1.6. I’ve created a simple ETL transformation that does something absurdly simple: generate summary sales figures by product.
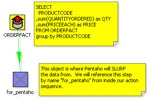
Step 2. Add a table output step to the transformation
What we’re going to do now is create a table that we’ll use ONLY during design time to build our report. Just use any database that you have access to while designing the report (MySQL or Oracle XE on your local machine?). Add a table output step to the transformation and click on the “SQL” button to have it generate the DDL for the table. Go ahead and execute the DDL to create your temporary table that we’ll use for designing our report. Name the table something silly like MYTEMPTABLE.

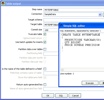
Step 3. Execute the mapping and populate the temporary table
Hit run and get data into that table. Now we have a table, MYTEMPTABLE that has the format and a snapshot of data we want to use for building our report.
Step 4. Write your report using the temporary table as a source
Open up Report Designer. Run through the wizard (or the Report Designer) as usual and build your report (with groupings, logos, images, totals, etc) just like you normally would. You will use the MYTEMPTABLE in your temporary database as your source for this report.
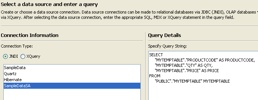
Nothing spectacular yet. All we’ve done is write a basic report against a basic table.
Step 5. Publish your report to Pentaho server and test
Using Publish (or Publish to Server) in the Pentaho Report Designer publish the report to the server so you can execute your report from the web using Pentaho. In this example I published the report to samples/etl so it’s alongside the example that we shipped with Pentaho demo server.
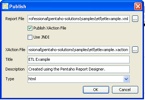
Let’s make sure that report showed up.

Great. Let’s click on it to make sure the report runs.

Ok. Our report (etlexample.xaction) runs inside of Pentaho. Again, at this point we’ve not done anything spectacular this is just a basic (read Ugly basic grey/white) report that just selects data from MYTEMPTABLE.
Step 6. Copy transformation so it’s beside the report
It’s not REQUIRED but it’s a very good idea to DISABLE the hop from the for_pentaho step and the table output. When we run this report now we don’t actually want to do any INSERTS into a table. If we disable the hop after for_pentaho then the transformation does ZERO DML.
The ETL transformation can really be anywhere, but it’s good practice to put the transformation (.ktr file) alongside the report. Copy the kettleexample.ktr file (from Step 1) to samples/etl so that it is sitting alongside etlexample.xaction.
Step 7. Swap from Relational to Pentaho Data Integration.
You could make the change directly to the .xaction to get it to source data from the Kettle transform. However, I’m going to copy etlexample.xaction to etlexample2.xaction just so that I can see both running side by side.
In Design Studio, copy etlexample.xaction to a new action sequence etlexample2.xaction.
Open up etlexample2.xaction and make the following changes.
First, change the name of the action sequence from ETL Transformation to ETL Transformation – NO TABLE

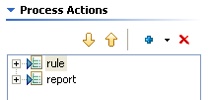
Second, remove the “relational” data that is producing the data for the report by highlighting the step named “rule” and then hitting the RED X to remove it.
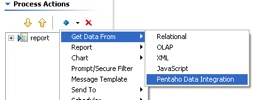
Third, add a Get Data From Pentaho Data Integration step ABOVE the report step.
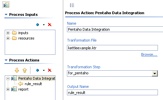
Fourth, configure the Pentaho Data Integration as follows.
Some notes about what we’ve just done there. We’ve told it the name of the Kettle transformation we’d like to use to get our data is kettleexample.ktr. There are two other important pieces of information we’ve filled in on that screen as well. We’ve told the component that we’ll get our data (rows) from the step named “for_pentaho.” The component will SLURP data from that step and stream it into the result. The other piece of information we’ve given to the component is what we want to name the result set so that the report knows where to get the results. Name the result set “rule_result.”
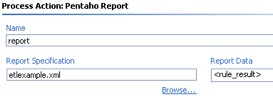
Finally, highlight the report step and make sure that the report is getting its data from “rule_result” but we shouldn’t have to change anything else about the report. Just where it was getting its data.
Step 8. Test your EII version of your same report
Navigate to find your new report you created that uses the Kettle ETL transformation INSTEAD of the table.

Click on ETL Example – NO TABLE and you should see the same data/report.

This report is NOT using MYTEMPTABLE and is instead, peering inside of kettleexample.ktr and getting its data from “for_pentaho” and generating the report.
Congratulations! You now have a method that you can use to create EII reports using the same visual tools as when normally developing against a relational source. Imagine the possibilities…. what you can do in Kettle (pivot, unpivot, lookup, calculate, javascript, excel, flat file, web service, XML streaming, call database procedures, and on and on and on) you can do for your reports.
Feedback welcome. The zip file for this example here. I built this example on 1.2 Demo Server GA but should work on 1.6 as well. All you need to do is unzip the file above into pentaho-demo/pentaho-solutions/samples/etl and you should have another working example.
Thank you for this blog post, it was quite helpful to me. May I publish a loose translation into German language in my blog? It would, of course, contain a link to your original.
Sure. Go right ahead.
Is there a way to run query on the report side? Like If I want to show only the products whose PRICE is greater than 2400?
Pingback: Open Source Business Intelligence » Blog Archiv » Kettle (PDI) für EII verwenden
is Kettle an open source tools for EII??
Thanks Nic for another interesting topic. As a matter of fact, I will try it immediately to resolve a problem I am having to chart a barlinecombo using and MDXLookup, which I can’t no matter how hard I try… Instead of the MDX lookup, I’ll kettle the MDX query to a table and then try charting using an SQLLookup… I’ll post if I’m suucessfull.
Regard, dtm