Category Archives: Open Source

An arms race my customers don't care about

Perfect is the enemy of good enough. This is fertile soil for why people choose to use the simpler, functional, cheaper open source cousins of proprietary feature function behemoths. Don’t get me wrong – too few features / crappy performance you lose customers because you’re not helping people solve problems if you lack too many features.

Recently, I observed a thread at the blog of Goban Saor entitled “Open Source Metrics.”

It basically has turned into a discussion which keeps creeping up about which tool is faster: Talend or Kettle. Which leads me to ask the question: Who Friggin’ Cares?

I’m a Kettle Expert so I think Kettle is Wicked Fast.
If I were a Talend Expert I’d think Talend is Wicked Fast.

Performance for customers who are focused on results, and aren’t technophiles boils down to these two requirements

  1. It has to meet my performance requirements for my project. If I have to load 1 million records per day and I have 10 minutes to do that then the tool either does or does not meet that performance requirement.
  2. It has to allow me to grow beyond my current performance requirements. I am loading 1 million records now, but in 3 years I may be loading 100 million records. Given the right investment in tuning and scaling I don’t want to have to change to a different tool when I go much bigger.

For Kettle the answer is pretty simple:

  1. I do a few simple mappings, hit run, do very little tuning/database optimization. Wham-o. 20k records / second throughput. Look and notice Kettle is simply sitting idle waiting for a database lookup. Add an index. Wham-o 35k records / second throughput. Have extra CPUs, fire up a few extra threads of a calculation step. Wham-o 40k / second. Surpasses customer batch window needs sufficiently; enough said. Requirement met – whether 35k records per second is slower or faster than someone else is irrelevant. Requirement met.
  2. This usually involves outside validations. What are other people doing – what are the proof points about the performance. I personally have worked on a Kettle scale out cluster with 5 nodes that reads, sorts, aggregates, and summarizes a billion FAT (wide character) records in an HOUR and scales almost perfectly linearly (* no tool grows at perfect linear). Telling a customer using the exact same binary you have there, you can scale out and process hundreds of millions into billions of records per hour. Requirement met – you can grow with your tool.

I think Kettle performance is superb. I’d welcome Talend folks to comment here and blog about their proof points for how Talend performance is superb. I believe that it is. Let’s just all consider the most important thing: open source ETL is about solving the ETL need well, not necessarily incremental performance differences.

It’s a debate with no winner. I don’t care if your tool is 2.5% faster at reading character text files than mine. I do care if it can scale out (requirement 2) and solves customer problems (requirement 1).

Hidden little trend arrows

Many readers of this blog use JPivot. The solidly average web based Pivot Viewer that I’ve heard described as a “relic” of the cold war – no frills utility software. However, as maligned as JPivot is, it does have some great features and has been production quality software for years now. One of these hidden little features that is in JPivot (and also in Pentaho) is the quick and easy way to add trend lines to a JPivot screen by simply using MDX.

Consider, for instance, this little bit of MDX:

with member [Measures].[Variance Percent] as ‘([Measures].[Variance] / [Measures].[Budget])’, format_string = IIf(((([Measures].[Variance] / [Measures].[Budget]) * 100.0) > 2.0), “|#.00%|arrow=’up’“, IIf(((([Measures].[Variance] / [Measures].[Budget]) * 100.0) < 0.0), “|#.00%|arrow=’down’“, “#.00%”))
select NON EMPTY {[Measures].[Actual], [Measures].[Budget], [Measures].[Variance], [Measures].[Variance Percent]} ON COLUMNS,
NON EMPTY Hierarchize(Union({[Positions].[All Positions]}, [Positions].[All Positions].Children)) ON ROWS
from [Quadrant Analysis]

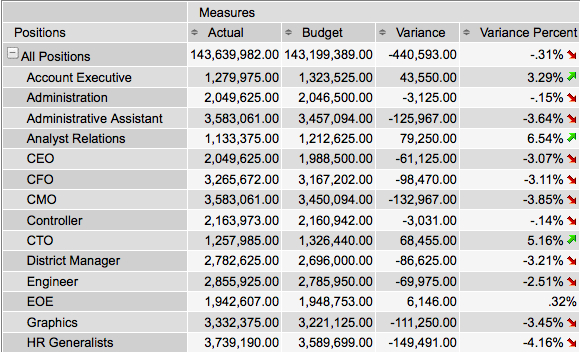
which produces this lovely set of arrows letting the user know how their individual variance value rates in terms of KPI thresholds.

200811111457

The secret of course, is the arrow= tag in the format string. Easy enough. “up” is a green up arrow. “down” is a little red arrow. “none” is no arrow.

Happy Visual Cue Indicator day to you all.

Oracle ACE: In Absentia

So… A few years back I spent a LOT of time with Oracle ETL and BI products. I learned them inside and out, gave some user conference presentations, wrote a bunch of blogs, even Alpha tested a version of Oracle Warehouse Builder. Then I found “Open Source BI” and I’ve been heading breakneck into the world of MySQL, Pentaho, … A choice I do NOT regret – my consultancy is busier than ever and I love the Open Source BI play.

However – I miss seeing some of the old Oracle peeps at Open World. This year, I even registered for my free ACE pass to OOW but didn’t make it because I started two new projects this week. What I realized this year, was that I’m WAY out of touch with what’s going on in the land of Big Red O. The words and products for BI whiz past me – they don’t even look anything like they did just a couple of years back.

I hope everyone had a good time at OOW this year! I don’t see a path back to the land of Oracle anytime soon for me. 🙁

Business Intelligence: Experience vs Sexy

A couple of postings over the past few days that prompted me to put some digital pen to paper so to speak. The first was a post by L. Wayne Johnson who works for Pentaho who I had the pleasure to meet last week in Orlando entitled “Is it just sexy?” The second was by a Ted Cuzzillo over at datadoodle.com entitled “Tableau is the new Mac” Both share important perspectives that deserve some more light.

First, we have to start with a premise that leads you to see why there are two somewhat divergent paths that products/people/companies are taking. BI is now a commodity. The base technology components for doing BI (reports, dashboards, OLAP, ETL, scheduling, etc) is commodotized. Someone once told me that once Microsoft enters and nails a market, you know it’s been commodotized and based on the success of MSAS/DTS/etc you can tell that MSFT entered long ago and nailed it. So, if you don’t believe that the raw technology for turnings data into information is essentially commodotized then you should stop reading now. The rest will be useless to you.

What happens when software becomes a commodity? There’s usually a mid market but you start to see players emerge at two ends of a spectrum.

Commodity End (Windows, Open Office, linux, Crystal Reports):

  • Hit the good side of the features curve. Definitely stay on the good side of the 80/20 rule.
  • Focus on lots and lots of basic features. You’re trying to appeal to lots and lots of people. If you’re pipe isn’t 1000x bigger than the other market you are toast.
  • Provide a “reasonable” quality product. To use a car metaphor, you build an automatic transmission car with manual windows. The lever to open and close the window doesn’t usually fall off and if it does, you’ve already put 100,000 miles on the car.
  • Treat the user experience as one category in “Features.” Usability is something you build so that customers don’t choose the other guy over you – it’s not core to your business, you just have to provide enough for them to be successful and not hate your product.
  • Sell a LOT of software. Commodity End of a market is about HIGH VOLUME (you should sell at least one or two orders of magnitude more than the experience end) – however, people looking for “reasonable commodity” products are cheap. They want low prices so this also means your MARGINs are lower. Commodity selling is about HIGH VOLUME, LOW MARGIN business. (Caveat: not always true).

Experienced Based (Mac, iPhone, Crystal XCelcius):

  • The good side of the 80/20 rule still applies. Experience based doesn’t always mean 100% high end, every bell and whistle.
  • Focus on features that matter to the user doing a job. If a feature is needed to help a customer nail a part of their using your product it, add it and make it better than they expect. Lacking features isn’t a bad thing if you keep adding them – for instance the iPhone was LAME feature for feature initially (no GPS, battery was a pain, etc) but users were patient.
  • Provide a high quality product that is as much about using as doing. The experienced based product says that it’s not enough to have a product that does what you want, but it has to be something you ENJOY using.
  • User and Experience is KING. Usability is not something that is a feature to implement, it’s the thing that informs, prioritizes and determines what features are implemented.
  • Sell some software. In order to get the driving experience a user wants (BMW 700x series) they are willing to pay for it. It’s a higher margin business and there’s no secret that if someone is looking for something that both works, and they LOVE to use then it’s worth more to them. It’s a LOWER VOLUME, HIGHER MARGIN business. (Caveat: not always true – things are relative. iPod is higher margin but also high volume).

So… Let’s get back to the point on BI. I’ve built some sexy BI dashboards for customers that look great, including some recent ones based on the Open Flash Chart library. However, I come more from the Data Warehouse side of the house so more of my time is spent on ETL, incremental fact table loads, etc. I understand that you have to have a base of function/feature to have a fighting chance on the experience side.

Sexy isn’t “just sexy” if done right. When done right, Sexy is called “Great Experience.”

Experience is about creating something that people want to use. People are happier with a software product when they enjoy using it. For instance, Ted refers to Tableau as “a radically new product.” I’ve seen it and it’s a GREAT experience, with some GREAT visualization but there’s nothing REVOLUTIONARY about it except for the experience. It’s not in the cloud, it’s not scaling beyond the petabytes, it’s not even a web product (it’s a windows desktop APP). Not revolutionary, just GREAT to use.

Tableau is an up and comer for taking something commoditized (software to turn data into insight) and making it fun to use and leaving users with a desire for more. Kudos to Tableau.

What about on the commodity side – that’s where players like Pentaho come in. They’ve built something that meets a TON of needs for a TON of customers and does so at a VERY VERY compelling price (free on open source side, or subscription for companies). Recall, Pentaho is the software that I use day in and day out to help customers be successful – and they are consistently. Pentaho is earnestly improving their usability that matches up with the philosophy of Usability is a category of features. Sexy is just Sexy for the kind of business and market they are trying to build. They want to make things look nice to be usable and help people do their job well but they’re not going to spend man years on whizbang flash charts. The commodity end is a great business model – Amazon.com is pointed about their business model of “pursuing opportunities with high volume and low margins and succeeding on operational excellence.” I consider Pentaho a bit more revolutionary than Tableau – it’s 100% platform independent and the rate at which open source development clips IS REVOLUTIONARY.

Pentaho is an up and comer for taking something commoditized (software to turn data into insight) and making it easy to obtain, inexpensive to purchase, and feature rich. Kudos to Pentaho.

Both sides of the market are valid. There’s a Dell and an Apple. There’s BMW and Hyundai – both are equally important to the markets they serve and the same is true for BI as a market.

PS – I do agree with L. Wayne Johnson that there can be sexy that is “just sexy.” A whizbang flash dial behind questionable data is pretty lame, or an animation that adds nothing to the data (see this Flash pie chart for an example of a useless sexy animation) The point being that if you consider the “antee” for the BI game at “good data” then the experience/feature sets/approach is what separates the market.

Ordered Rows in Kettle

There was a question posed the other day on the Pentaho forums about how to get Kettle to process “all the rows” at one step before beginning execution on the others. Sven suggested to use the “execute once for every row” as a solution which I think is probably overall, a cleaner way to accomplish a multistep process. However, it is possible to do this in Kettle now.

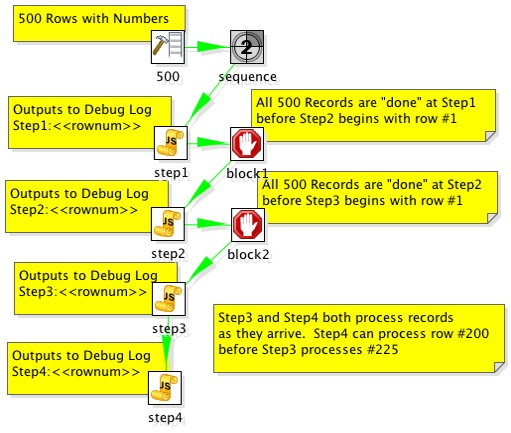
The solution is to add “Blocking Step”s in your transformation where you need the whole thing to have completed before continuing processing.

Consider the following example:

200806251534

The step “block1” does not pass rows to Step2 until all rows have finished at Step1. This accomplishes the desired outcome of ensuring that all records have completed processing on step1 before step2 processes. The example transformation outputs to the debug log and it’s clear that they are output in the correct order.

2008/06/25 15:25:04 - step1.0 - Step1:1
2008/06/25 15:25:04 - step1.0 - Step1:2
2008/06/25 15:25:04 - step1.0 - Step1:3
2008/06/25 15:25:04 - step1.0 - Step1:4
2008/06/25 15:25:04 - step1.0 - Step1:5
...
2008/06/25 15:25:05 - step1.0 - Step1:499
2008/06/25 15:25:05 - step1.0 - Step1:500
...
2008/06/25 15:25:05 - step2.0 - Step2:1
2008/06/25 15:25:05 - step2.0 - Step2:2
2008/06/25 15:25:05 - step2.0 - Step2:3
2008/06/25 15:25:05 - step2.0 - Step2:4
2008/06/25 15:25:05 - step2.0 - Step2:5
...
2008/06/25 15:25:05 - step2.0 - Step2:499
2008/06/25 15:25:05 - step2.0 - Step2:500
...
2008/06/25 15:25:05 - step3.0 - Step3:1
2008/06/25 15:25:05 - step3.0 - Step3:2
2008/06/25 15:25:05 - step3.0 - Step3:3
2008/06/25 15:25:05 - step3.0 - Step3:4
2008/06/25 15:25:05 - step3.0 - Step3:5
2008/06/25 15:25:05 - step3.0 - Step3:6
2008/06/25 15:25:05 - step3.0 - Step3:7
2008/06/25 15:25:05 - step4.0 - Step4:1
2008/06/25 15:25:05 - step3.0 - Step3:8
2008/06/25 15:25:05 - step4.0 - Step4:2
2008/06/25 15:25:05 - step3.0 - Step3:9
2008/06/25 15:25:05 - step4.0 - Step4:3
2008/06/25 15:25:05 - step4.0 - Step4:4

Example here: ordered_rows_example.ktr

Pentaho Fat Clients: Breaking into Double Digits

Business Intelligence is a complex diverse space. There’s a bunch of technologies that typically need to be combined together to get a comprehensive, end to end solution.

One of the things that I believe is confusing for users of Pentaho is the sheer volume of clients that are available to “quickly and easily” build your solution. The quickly and easily is predicated on the fact that if you need to build a “prompt” for a report, you know which of the fat clients to fire up. Want to dynamically hide a field? In order to do that you have to know that’s in a different fat client.

I know of at least 10 different good ole fashioned, download and install to your desktop clients that you’d use if you were doing a full, soup to nuts everything used Pentaho installation.

  • Design Studio
  • Report Designer
  • Report Design Wizard
  • Mondrian Workbench
  • Pentaho Metadata Editor
  • Spoon (Kettle)
  • Cube Designer
  • Weka Explorer
  • Weka Experimenter
  • <<new fat client Pentaho hasn’t announced yet>>

This is no easy challenge to solve for Pentaho. Part of the open source mantra includes making each of the individual projects (Kettle/Mondrian/Weka/etc) useful on their own, without some big Pentaho installation. What that means is a challenge to make a UI/designer/etc that works “standalone” but could also be included in some master development environment? That’s tough, and to date Pentaho has made only modest steps at this (Wizard inside of Designer).

I have no good advice for Pentaho in this regard. There’s a very good reason for keeping them as separate installations and I think it shows respect to the individual communities. However, this is an issue for people coming to Pentaho as a full BI suite. Does anyone have any good ideas on how to solve this pickle of a problem? We should all help Pentaho with this as it benefits everyone to come up with a good way to approach the development tools (as a suite and as individual products).

PS – My $HOME/dev/pentaho directory is littered with old installations. Every time Pentaho goes from 1.6.0 GA to 1.6.1 GA the only way to ensure you’re getting the correctly matched versions is to upgrade all those clients.

bayon is back

For readers who have been perusing since the early days of this blog (bayon blog) you’ll know what I’m talking about. If you’re a reader that has joined in the past year and half you’re probably wondering “What is bayon?”

bayon is a boutique consulting firm specializing in Business Intelligence implementations; it’s my company that I’ve operated since 2002. I put it on the back burner when I put on a Pentaho jersey and played a few games on the Pentaho team. I’m leaving (actually, left) Pentaho. My time at Pentaho was great. The Pentaho tribe is a great group of kind, honest, smart people. Rare to find the intersection of good people and good technologists.

I’ve felt the siren call of helping customers in a more entrenched way. Consulting does that I think. So, not like it’s a big announcement, but it is belated as my last day at Pentaho was nearly two months ago:

I’m now working at bayon full time building a dedicated practice around Open Source BI technologies in the enterprise. Bayon has joined the Pentaho partner program as a Certified Systems Integrator.

So there you have it. Shingle is out.

If you are interested in Pentaho, Open Source ETL, Open Source BI, etc don’t hesitate to be in touch.

PS – It’s also worth noting that my leaving has no reflection on the progress of the business. Quite the opposite really; some would consider me foolish for leaving when the company is doing as well as it is!

Using Kettle for EII

Pentaho Data Integration (aka Kettle) can be used for ETL but it can also be used in EII scenarios. For instance, you have a report that can be run from a customer service application that will allow the customer service agent to see the current issues/calls up to the minute (CRM database) but also give a strategic snapshot of the customer from the customer profitability and value data mart (data warehouse). You’d like to look a this on the same report that with data coming from two different systems with different Operating Systems and databases.

Kettle can make short work of this using the integration Pentaho provides and the ability to SLURP data from an ETL transform into a report without the need to persist to some temporary or staging table. The thing that Pentaho has NOT made short work of, is being able to use the visual report authoring tools (Report Designer and Report Design Wizard) to be able to use a Kettle transform as a source for the report during design time. That’s an important point worth repeating.

As of Pentaho 1.6, Pentaho provides EII functionality at RUNTIME but NOT at DESIGNTIME.

So, you can use an ETL transform as the source of a report, and there two examples of that. In the samples/etl directory that ships in the Pentaho BI Suite demo or you can see another example in an earlier blog entitled “Simple Chart from CSV“.

What is the best method for building reports that are going to use this functionality?

I, like others who use the Pentaho product suite, would like to use the Report Designer to build my report visually but have the data actually coming from an EII transformation. This blog is about those steps.

Step 1. Create your data set

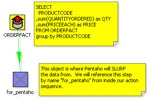
Build an ETL transformation that ends with the data you want to get on your report. Use several databases, lookups, calculations, excel files, whatever you want. Just get your data ready (use the Preview functionality in Kettle). You’d do this with Kettle 2.5.x if you want to deploy into Pentaho 1.6. I’ve created a simple ETL transformation that does something absurdly simple: generate summary sales figures by product.
200708151622
Step 2. Add a table output step to the transformation

What we’re going to do now is create a table that we’ll use ONLY during design time to build our report. Just use any database that you have access to while designing the report (MySQL or Oracle XE on your local machine?). Add a table output step to the transformation and click on the “SQL” button to have it generate the DDL for the table. Go ahead and execute the DDL to create your temporary table that we’ll use for designing our report. Name the table something silly like MYTEMPTABLE.
200708151624
200708151627

Step 3. Execute the mapping and populate the temporary table

Hit run and get data into that table. Now we have a table, MYTEMPTABLE that has the format and a snapshot of data we want to use for building our report.

Step 4. Write your report using the temporary table as a source

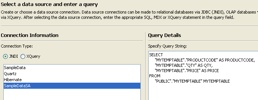
Open up Report Designer. Run through the wizard (or the Report Designer) as usual and build your report (with groupings, logos, images, totals, etc) just like you normally would. You will use the MYTEMPTABLE in your temporary database as your source for this report.
200708151631

Nothing spectacular yet. All we’ve done is write a basic report against a basic table.

Step 5. Publish your report to Pentaho server and test

Using Publish (or Publish to Server) in the Pentaho Report Designer publish the report to the server so you can execute your report from the web using Pentaho. In this example I published the report to samples/etl so it’s alongside the example that we shipped with Pentaho demo server.
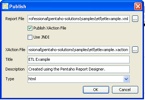
200708151634

Let’s make sure that report showed up.
200708151635

Great. Let’s click on it to make sure the report runs.
200708151636

Ok. Our report (etlexample.xaction) runs inside of Pentaho. Again, at this point we’ve not done anything spectacular this is just a basic (read Ugly basic grey/white) report that just selects data from MYTEMPTABLE.

Step 6. Copy transformation so it’s beside the report

It’s not REQUIRED but it’s a very good idea to DISABLE the hop from the for_pentaho step and the table output. When we run this report now we don’t actually want to do any INSERTS into a table. If we disable the hop after for_pentaho then the transformation does ZERO DML.

The ETL transformation can really be anywhere, but it’s good practice to put the transformation (.ktr file) alongside the report. Copy the kettleexample.ktr file (from Step 1) to samples/etl so that it is sitting alongside etlexample.xaction.

Step 7. Swap from Relational to Pentaho Data Integration.

You could make the change directly to the .xaction to get it to source data from the Kettle transform. However, I’m going to copy etlexample.xaction to etlexample2.xaction just so that I can see both running side by side.

In Design Studio, copy etlexample.xaction to a new action sequence etlexample2.xaction.

Open up etlexample2.xaction and make the following changes.

First, change the name of the action sequence from ETL Transformation to ETL Transformation – NO TABLE
200708151647

Second, remove the “relational” data that is producing the data for the report by highlighting the step named “rule” and then hitting the RED X to remove it.
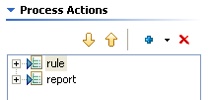
200708151649
Third, add a Get Data From Pentaho Data Integration step ABOVE the report step.
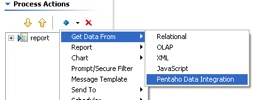
200708151651

Fourth, configure the Pentaho Data Integration as follows.
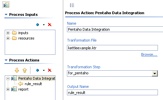
200708151650

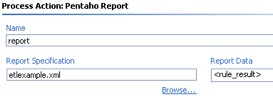
Some notes about what we’ve just done there. We’ve told it the name of the Kettle transformation we’d like to use to get our data is kettleexample.ktr. There are two other important pieces of information we’ve filled in on that screen as well. We’ve told the component that we’ll get our data (rows) from the step named “for_pentaho.” The component will SLURP data from that step and stream it into the result. The other piece of information we’ve given to the component is what we want to name the result set so that the report knows where to get the results. Name the result set “rule_result.”

Finally, highlight the report step and make sure that the report is getting its data from “rule_result” but we shouldn’t have to change anything else about the report. Just where it was getting its data.
200708151658

Step 8. Test your EII version of your same report

Navigate to find your new report you created that uses the Kettle ETL transformation INSTEAD of the table.
200708151658-1

Click on ETL Example – NO TABLE and you should see the same data/report.
200708151659

This report is NOT using MYTEMPTABLE and is instead, peering inside of kettleexample.ktr and getting its data from “for_pentaho” and generating the report.

Congratulations! You now have a method that you can use to create EII reports using the same visual tools as when normally developing against a relational source. Imagine the possibilities…. what you can do in Kettle (pivot, unpivot, lookup, calculate, javascript, excel, flat file, web service, XML streaming, call database procedures, and on and on and on) you can do for your reports.

Feedback welcome. The zip file for this example here. I built this example on 1.2 Demo Server GA but should work on 1.6 as well. All you need to do is unzip the file above into pentaho-demo/pentaho-solutions/samples/etl and you should have another working example.
Meet me in San Francisco: Pentaho Training

I am going to be the instructor for the Operational Business Intelligence course in April.  This particular course digs into the reporting tools, scheduling, processes, design, etc.  Basically, everything you need to build a reporting-centric solution using Pentaho.

Operational Business Intelligence – San Francisco, CA

303 Twin Dolphins Drive
Suite 600
Redwood City, CA  94065
USA
Monday, April 23, 2007 – Thursday, April 26, 2007

I’m curious: if you signup for the course having learnt about it here, put in the notes that was the case.  I’ll bring a special Pentaho shwag gift to anyone who signs up from this blog readership in the next two weeks!

PS – I know I know.  Redwood City isn’t technically SFO but … whatever!