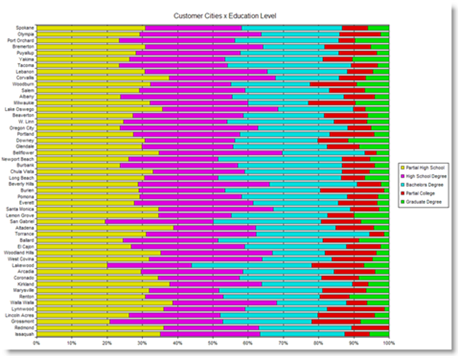
What’s so special about this graph? Well, other than the fact that it’s a really cool way to translate an XML document into a visual HTML report (this isn’t an image, it’s actually an HTML document) the technologies used to produce it are REALLY compelling. Chris Harrington and I spent a couple of hours this morning, working to generate a few reports using both of our “technology stacks” and with just a few small adjustments we were able to do something that spells big potential.
Let me first describe exactly how this chart was built:
- An XMLA request was passed OVER THE INTERNET (from Pittsburgh to Seattle) from the ThinOLAP command line XMLA client to a Mondrian instance I have running in my lab.
- The XMLA request was parsed and passed to the Mondrian ROLAP server that issued JDBC calls to my BizGres database.
- My BizGres database executed a handful of SQL statements that Mondrian used to generate the actual data values for the MDX query passed from across the country.
- The XMLA response was sent back OVER THE INTERNET (from Seattle to Pittsburgh) to the ThinOLAP command line.
- The ThinOLAP then did a post processing XSLT transformation to take the boring XMLA results (ie, pure data) and turn it into a really compelling chart.
Why is this exciting?
First off, because it’s using XML for Analysis which was supposed to be a hot ticket item, but has less than stellar support from vendors (including the 8000 lb guerrilla that “supports” the standard). There are a handful of XMLA clients, almost ALL of which are tied up in “dot net this” and “dot net that” and are clearly written to work with SQL Server 2005 Analysis Services. Mondrian happens to be the only other PUBLIC/PRODUCTION OLAP server that implements the interface (if the other vendors are actually public with their XMLA providers please let me know on email). We proved that the standard is pretty sound and that with small amounts of tweaking interoperation is pretty straightforward! UPDATE: I’ve just read that HYPERION has a provider, but I’m uncertain of how useful it is in practice. It also appears that SAS has a provider but again I’m not sure if there any clients that aren’t fused to the existing MS technologies (OLEDB etc).
Secondly, because it’s running over the Internet at pretty respectable speeds. Between two remote offices the REQUEST/RESPONSE was reasonable (a couple of seconds). This is one of the first times I’ve actually received some benefit from a SOA perspective over the Internet. Chris and I figured it was HTTP, there was no need shipping software back and forth we just did some port forwarding and it all worked BRILLIANTLY. We proved that XMLA can work, reasonably, over the public internet.
Thirdly, the server side is 100% OSI Certified software. That’s right… my provider was serving up OLAP goodies using Linux, Tomcat, Mondrian (part of the Pentaho platform), and BizGres. There were ZERO proprietary applications running to build and deliver the XMLA responses. The XMLA client (ThinOLAP) is an freeware product that uses from Microsoft packages for XML processing, scripting, transformations, etc. We proved that one can build an open source OLAP solution that can be leveraged by whizbang clients.
Beyond open source, Mondrian is a JDBC ROLAP server so it can be plugged into just about any database that supports JDBC. Choice is GOOD! Oracle anyone? The potential of actual interoperating XMLA clients is HUGE! Think about how many boutique visualization, charting, and reporting engines have been fused to OLE DB and other proprietary protocols. Perhaps a handful interoperating clients/servers will entice the others to write to the actual standard?
Chris and I continue to work at seeing what potential exists for interoperating his Intrasight Product with Mondrian. If you’re interested in using Mondrian or a nice AJAX client for Mondrian please don’t hesitate to be in touch with either of us in this regard.

Hi! I am investigating XMLA+Mondrian to complement a Poisoncenter management system I am setting up. Your experiment is encouraging.
One remark on your nice graph: either the sequence of the towns means something (they are encountered one after the other on Route 66!) or it could be more informative by sorting it along one of the values (for instance % of people achieving only partial high school). The best would be to have a link to your JPivot application to create our own graphs!!!
Christophe… I was very pleased with how XMLA worked between the Mondrian and the ThinOLAP tool. I believe that Chris (at activeinterface.com) has also gotten his Intrasight Product to work with Mondrian.
I’ve recently found some interesting “under the covers” issues with XMLA that have little to do with the technology. This mostly has to do with they way that Microsoft “promotes standards” (sarcastic tone implied), but that will be a blog entry coming up when I have all the facts in.
btw, I’m now part of Pentaho. We’re actively investing in Mondrian so look for more posts on Mondrian here. Consider being in touch we us (me, my email is on the right) if your interest in Mondrian needs some additional information.
all that M$ slamming, and then the Intrasight Project being an IE app (not to mention that this post is filed under Open Source) lol
j/k, I just got around to reading Udell’s post, very nice work guys, filed in my don’t-forget-locker!
http://weblog.infoworld.com/udell/2006/06/29.html#a1479
woops, one more slam: I just noticed your “this isn’t an image”, currently is a png. I assume you are tweaking as we speak, G/L.
hi
i need some information