Category Archives: General BI

Kettles secret in-memory database

Kettles secret in-memory database is

  1. Not actually secret
  2. Not actually Kettles

There. I said it, and I feel much better. 🙂

In most circumstances, Kettle is used in conjunction with a database. You are typically doing something with a database: INSERTs, UPDATEs, DELETEs, UPSERTs, DIMENSION UPDATEs, etc. While I do know of some people that are using Kettle without a database (think log munching and summarization) a database is something that a Kettle developer almost always has at their disposal.

Sometimes there isn’t a database. Sometimes you don’t want the slowdown of persistence in a database. Sometimes you just want Kettle to just have an in memory blackboard across transformations. Sometimes you want to ship an example to a customer using database operations but don’t want to fuss with database install, dump files, etc.

Kettle ships with a Hypersonic driver, and therefore, has the ability to create an in memory database that does (most) everything you need database wise.

For instance, I’ve created two sample transformations that use this in-memory database.

The first one, kettle_inprocess_database.ktr, loads data into a simple table:
200706202230

The second one, kettle_inprocess_database_read.ktr, reads the data back from that simple table:
200706202235

To setup the database used in both of these transformations, which has no files, and is only valid for the length of the JVM I’ve used the following Kettle database connection setup.

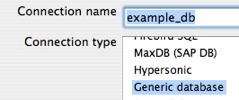
I setup a connection named example_db using the Generic option. This is so that I have full control over the JDBC URL.
200706202227

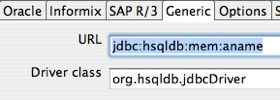
I then head to the Generic tab and input by URL and Driver. Nothing special with the driver class, org.hsqldb.jdbcDriver that is just the regular HSQLDB driver name. The URL is a little different then usual. The URL provided tells hypersonic to use a database in-memory with no persistence, and no data fil.e”
200706202225

Ok, that means the database “example_db” should be setup for the transformations.

Remember, there is NOTHING persistent about this database. That means, every time I start Kettle the database will have no tables, no rows, no nothing. Some steps to run through this example.

  1. Open kettle_inprocess_database. “Test” the example_db connection to ensure that I / you have setup the in-memory database correctly.
  2. Remember, nothing in the database so we have to create our table. In the testing table operator, hit the SQL Button at the bottom of the editor to generate the DDL for this smple table.
  3. Run kettle_inprocess_database and verify that it loaded 10 rows into testingtable.
  4. Run kettle_inprocess_database_read and verify that it is reading 10 rows from the in-memory table testingtable.

I should note that using this approach isn’t always a good idea. In particular there’s issues with memory management, thread safety, it definitely won’t work with Kettles clustering features. However, it’s a simple easy solution for some circumstances. Your mileage may vary but ENJOY!
MySQL Archive Tablespace for FACTs

I’m visiting a Pentaho customer right now whose current “transaction” volume is 200 million rows per day.  Relatively speaking, this puts their planned warehouse in the top quintile of size.  They will face significant issues with load times, data storage, processing reliability, etc.  Kettle is the tool they selected and it is working really well.  Distributed record processing using Kettle and a FOSS database is a classic case study for Martens scale out manifesto

This organization doesn’t have unlimited budget.  Specifically, they don’t have a telecom type budget for their telecom like volume of data.  One of the issues that has come up with their implementation has been the tradeoff between space, and keeping the base level fact records.  For example, at 200 million / day and X bytes per fact you start to get into terabytes of storage quickly.  It was assumed, from the start of the project, only summary level data could be stored for any window of time exceeding 10 days or so. 

The overall math is sound. 

Size per record (S) x number of records per day (N) = size per day of data growth (D)

In this equation, there’s really not much we can do, if we want to keep the actual base level transaction, about the number of records per day.  N becomes a fixed parameter in this equation.  We do have some control over the S value, which is mostly about what this blog is about.

Can we reduce the size of S by such an amount that D becomes more realistic?  The answer is the ARCHIVE engine in MySQL.

I created the DDL for a typical fact record.  Few Dimension IDs and a few of numeric values.

CREATE TABLE test_archive
(
  DIM1_ID INT
, DIM2_ID INT
, DIM3_ID INT
, DIM4_ID INT
, DIM5_ID INT
, NUMBER1 FLOAT
, NUMBER2 FLOAT
, NUMBER3 FLOAT
, NUMBER4 FLOAT
) engine=ARCHIVE
;

I did this in MyISAM as well

CREATE TABLE test_myisam
(
  DIM1_ID INT
, DIM2_ID INT
, DIM3_ID INT
, DIM4_ID INT
, DIM5_ID INT
, NUMBER1 FLOAT
, NUMBER2 FLOAT
, NUMBER3 FLOAT
, NUMBER4 FLOAT
) engine=MyISAM
;

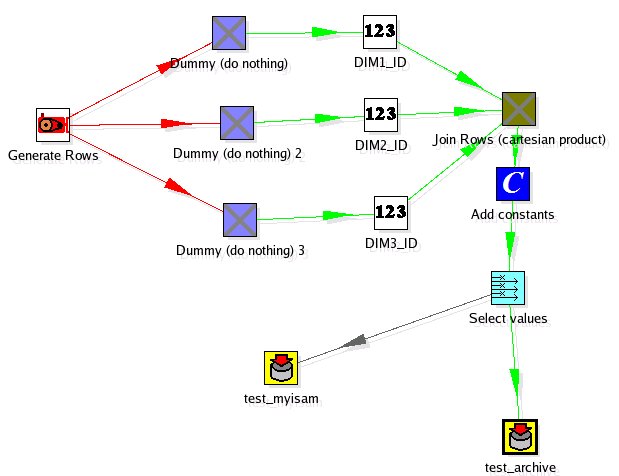
I used a simple Kettle transformation to populate both the these tables with 1 million rows of data. It wasn’t scientific but the INSERT performance of the Archive and MyISAM tables were very similar (within 10% of the throughput of rows).

So now we have a million rows, with a reasonable FACT record format.  How much space do these 1 million rows require to store?

+--------------+---------+---------------+------------+
| table_name | engine | total_size_mb | table_rows |
+--------------+---------+---------------+------------+
| test_archive | ARCHIVE | 2.63 | 1000000 |
| test_myisam | MyISAM | 36.24 | 1000000 |
+--------------+---------+---------------+------------+

The Archive table uses an order of magnitude LESS space to store the same set of FACTS.  What about query performance?  I’ll have to do another blog on a more scientific approach but the anecdotal query performance on typical OLAP queries (select sum() from fact group by dim1_id) seemed related (less than a 15% difference). 

Let’s be clear here, one MUST have a good aggregate table strategy so the fact records are RARELY accessed because the performance will not rock your world.  However, this is the case with these volumes anyhow.  Summaries and Aggregates have to be built for the end user to have a good experience on the frond end.

Archive engine is strange. INSERT/SELECT only.  You can’t do ANYTHING with it, except drop and recreate it.  For historical fact loads on “settled” DW data segmented on a daily basis this is usually not an issue.  No transactions need, no DML needed.  I’d also like to see how this compares to “packed” MyISAM tables at some point.  I’m guessing I wouldn’t expect to see it beat the compression in terms of storage space, but there’s some nice things you can do with MyISAM tables (for instance, MERGE).

Back of the napkin calculation to handle BIG data volume:

2.63 MB / million * 200 per day = 526 MB / day
526 MB / day * 365 days = 187.5 GB

Anyone else have fun experiences to share with the Archive engine?

Side Note:
  I did all this testing on a VNC Server enabled EC2 instance I use for testing.  Fire it up, VNC in, do my testing, shut it down.  I LOVE EC2!

Meet me in San Francisco: Pentaho Training

I am going to be the instructor for the Operational Business Intelligence course in April.  This particular course digs into the reporting tools, scheduling, processes, design, etc.  Basically, everything you need to build a reporting-centric solution using Pentaho.

Operational Business Intelligence – San Francisco, CA

303 Twin Dolphins Drive
Suite 600
Redwood City, CA  94065
USA
Monday, April 23, 2007 – Thursday, April 26, 2007

I’m curious: if you signup for the course having learnt about it here, put in the notes that was the case.  I’ll bring a special Pentaho shwag gift to anyone who signs up from this blog readership in the next two weeks!

PS – I know I know.  Redwood City isn’t technically SFO but … whatever!

BI Documenter looks cool

One of the things I love to do, is connect with fellow bloggers and chat over mutual interests.  It sounds silly, since there are like 100 million blogs or something, but there’s a certain camaraderie and shared identification amoungst bloggers.  I’ve always had fantastic meetups from the UK to OZ to the good ole USA.

While in Sydney I had the good fortune to connect with the folks behind the product, BI Documenter.  John, Richard, and Cyril are the principals involved in building what looks to be a sweet little product.  It’s a great concept:  collect and process the metadata from SQL Server, MSAS, Integration Services, Reporting Services and build some useful documentation about your BI Solution.

They have a live set of these docs here: http://www.bidocumenter.com/Sample/Index.htm
 but here’s a snapshot of the main table of contents once its done its slurping.

How many times have we wanted shoot ourselves when the business users ask some simple, straightforward questions about their reports because we’ve explained it about one hundred times.  Does net sales take into account product returns?   If you’re a MSFT (grumble) solution, you don’t have to answer these questions again and again and again and again.  You can provide documentation that will provide these answers for your users.  From what I saw, the navigation will be very familiar and similar to a “Help” system.

I can’t tell you how many more times the $$ of their license I would pay to have this for past Oracle engagements.  If you’re a MSFT shop, definitely check them out.  They even have a FREE VERSION which works on just one data source (SQL Server).

Disclosure:  I haven’t used it, and probably won’t because my day to day life keeps me in non-MSFT BI land.

Sales Percent increase month to month, qtr to qtr

This is a common situation:  Don’t show me what my total sales figures were month after month, show me something that describes something important to my business.  ie, Sales Growth

Chris Webb, who runs a wildly popular MSFT blog in addition to being an in demand independent consultant, wrote an article on Previous Period Growth using Pentaho.  Mondrian (Pentaho Analysis Server) uses MDX, a powerful expressive multidimensional query language which Chris is one of the leading experts on its practical use and applications.

Chris outlines how to build a “custom” calculated measure that displays the Sales Previous Period Growth:

All you need is the zero install pentaho demo installation to run through his tech tip, available at http://www.pentaho.org/download/latest.php

Remember, this isn’t trivial (ie, writing MDX fragments) but it’s VERY VERY powerful.  Check out the Mondrian MDX reference here for some of the powerful analytic calculations available.  Remember, once you’ve got your MDX member working properly HIDE that complexity from your users by adding it to the Mondrian OLAP schema definition.

Kettle and Pentaho: 1+1=3

Like all great open source products, Pentaho Data Integration (Kettle) is a functional product in and of itself.  It has a very productive UI and delivers exceptional value as a tool in and of itself.  Most pieces of the Pentaho platform reflect a desire to keep the large communities around the original projects (Mondrian, JFree, etc) engaged; they are complete components in and of themselves.

When used together their value, as it relates to building solutions increases and exceeds their use independently.  I’ll be the first to admit that Pentaho is still fairly technical, but we’re rapidly building more and more graphical interfaces and usability features on top of the platform (many in the open source edition, but much is in the professional edition).  Much of this work involves making the "whole" (Pentaho)  work together to exceed the value of the pieces (Mondrian, Kettle, JFree, …).

A few things immediately come to mind of why Pentaho and Kettle together provide exceptional value as compared to used individually or with another open source reporting library:

  1. Pentaho abstracts data access (optionally) from report generation which gives report developers the full POWER of Kettle for building reports.

    There are some things that are tough, if not downright impossible to do in SQL.  Ever do an HTTP retrieval of an XML doc, slurp in a custom lookup from Excel, do a few database joins and analytical calculations in a SQL statement?  I bet not.  Report developers are smart data dudes; having access to a tool that allows them to sort/pivot/group/aggregate/lookup/iterate/list goes on and on/etc empowers report developers in a way that a simple "JDBC" or "CSV" or "XQuery" alone can accomplish. 
    How is this made possible?
    Pentaho abstracts (optionally, it isn’t forced on customers) the data retrievals to lookup components.  This allows BI developers to use either a SQL lookup (DB), XQuery lookup(XML), MDXLookup (OLAP), or Kettle lookup (EII) to populate a "ResultSet."  Here’s the beauty; reports are generated off a result set instead of directly accessing the sources.  This means that a user can use the same reporting templates, framework, designer, etc and feed/calculate data from wherever they desire.  Truly opens a world of possibiliy where before there was "just SQL" or "ETL into DB tables."

  2. Ability to manage the entire solution in one place

    Pentaho has invested greatly in the idea of the solution being a set of "things" that make up your BI, reporting, DW solution.  This means you don’t have ETL in one repository, reports managed somewhere else, scheduling managed by a third party, etc.  It’s open source so that’s obviously a choice, but we can add much value by ensuring that someone who has to transform data, schedule that, email and monitor, secure, build reports, administer email bursting, etc can do some from one "solution repository." Managing an entire BI solution from one CVS repository?  Now that’s COOL (merge diff/patch anyone?).

  3. Configuration Management

    Kettle is quite flexible; the 2.3.0 release extends the scope and locations where you can use variable substitution.  From a practical standpoint this means that an entire Chef job can be parameterized and called from a Pentaho action sequence.  For instance, because you can do your DW load from inside Pentaho action sequences that means you can secure it, schedule it, monitor it, initiate it from an outside workflow via web service, etc.  In one of my recent Kettle solutions ALL OF THE PHYSICAL database, file, and security information was managed by Pentaho so the Kettle mappings can literally be moved from place to place and work inside of Pentaho. 

  4. Metadata and Additional Integration

    Pentaho is investing in making the tools more seamless.  In practice (this is not a roadmap or product direction statement) this means being able to interact with tables, connections, business views inside of Kettle in an identical (at least similar way) in the report designer.  For example, if you’ve defined the business name for a column to be "Actual Sales" Kettle and the Report Designer can now key off that same metadata and present a "consistent" view to the report/ETL developer instead of knowing that "ACT_SL_STD_CURR" is actual sales. 
    Another example is the plans to do some additional Mondrian/Kettle integration to make the building of Dimensions, Cubes, and Aggregates easier.

Free, Valuable, DW Wisdom from man in lilac suit

For those that don’t know the reference between lilac suit and Pete-s, just google it.  🙂  Doesn’t really matter though when compared with the great set of articles that my friend Pete-S is pumping out from the other side of the Atlantic.

Pete has in the trenches practical knowledge building BI and DW systems.  He’s both sharp, and practical (that’s rare you know!).  He’s running a series DW Wisdom and it’s some very useful content.

DW Wisdom

I like that Pete is comfortable enough with his own skills/abilities to question the "age old wisdoms" of DW.  Even if they are found to be true it’s good to see some real scientific "assumption breaking" to prove/disprove reality.

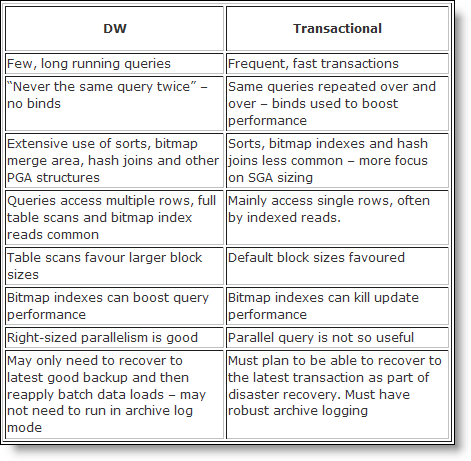
  • Use as many small disks as possible – a 1TB disk would be a bad idea for a system that inherently reads large volumes of data, everything would go through a single IO point.

    • Keep all the OLTP tables separate from the DW systems; OLTP has lots of small, fast transactions, DW has slower, big reads. DW loves bitmap indexes, OLTP hates them.

    • Use high degrees of parallel processing

But are these truths still valid?

DI Wisdom (2) – more of the physical

Comparison of OLTP vs DW(OLAP-esque):  Great reference table:

DI Wisdom (3) – departmental business

When people found that their transactional systems were unsuited for BI reporting (perhaps because of the performance impact of running BI on a transactional system, or the transactional system did not hold all of the data required for reporting) they started to look towards dedicated data warehouses.

DI Wisdom (4)

Enterprise DW moves away from the tactical departmental “point solutions” and into something that fits with strategic aspirations of the enterprise. On the face of it having a single solution across the enterprise as distinct advantages:

  • there is a single, consistent model of enterprise data

    • there is less duplication of data across the enterprise
    • it is possible to construct a security model such that the right people see all of the data that allows them to their jobs but not the information that is too sensitive for their job role
    • the origins of all of the business data can be traced back to source

In fact these aims are so laudable that they have been hijacked by other IT disciplines such as master data management, risk and compliance management, and business process reengineering.

DW Design (part 1)

I can’t agree with Pete more: A staging, 3NF warehouse, and then presentation layer (marts) I think is a very practical way to seperate concerns, and avoid tight coupling between source and reports.  A la Corporate Information Factory.

For a long while I have favoured a three section data warehouse design: a staging area where raw fact and reference data is validated for referential integrity, a third-normal form layer to hold the reference data and historical fact, and finally a presentation layer to hold denormalised reference data and aggregated fact. The staging layer is ‘private’ to the data warehouse but user query access (subject to business security rules) to other layers is permitted. In some cases it will not be possible to use a denormalised layer; but if you can use one, you should.

DW Design (2) – staging data

As mentioned yesterday, the staging area of the data warehouse has three functional uses:

  • It is the initial target for data loads from source systems

    • It validates the incoming data for integrity

    • It is the data source for information to be published the ‘user visible” layers of the data warehouse

Optionally, it may also be where the logic to transform incoming data is applied.

Great series Pete!  Now if only this were in a book that I could tell all my blog readers and colleagues to purchase!  🙂

Use Open Source BI: Win a Mac Mini

Tomorrow MySQL and Pentaho are presenting on how MySQL and Pentaho can work together to deliver exceptional value when used in combination to solve Business Intelligence and Reporting business challenges.

I’ve been working more and more with MySQL over the past couple of months since joining Pentaho and I’m pleasantly surprised.  On the good side of the 80/20 rule (ie, 80% of users want 20% of the features) it’s exceptionally "good enough" for things that I want to do.

Back to the tagline.

Tomorrow, Pentaho is highlighting our desire to be as easy to MySQL users as MySQL is.  We want to understand how to make it increasingly easy to use Pentaho with MySQL.  In return for providing Pentaho with much needed feedback on ease of use and the user experience for installation/configuration Pentaho is giving away a Mac Mini.  It’s no iPod, thank heavens, as everyone is giving those away these days. 

10am PT, 1pm ET in the US.  Register and dial in here.  Read the press release here.

DAMA-PS Session: Forget Federated

I had listen to Stephen A. Brobst, CTO at NCR Teradata about “Best Practices in Meta Data Management and Enterprise Data Warehouse Deployment” this morning. I was hoping to grok some details about new metadata management techniques, but what the presentation was much more focused on the “deployment/architecture” side. That being said, I think it was MUCH more useful for the the audience as a whole to cover the deployment in as much detail; I personally didn’t find it all that groundbreaking.

Summary: Build an EDW based on a 20,000 ft blueprint, integrate your data into a single location (say, perhaps, a massively scalable single system image shared nothing database) using a relational schema, build a subject area at a time, and star schemas only when performance is an issue. Clearly the architecture is advocating the Oracle/Teradata/etc view of the world that says ONE GIGUNDOUS RELATIONAL warehouse with various semantic (dimensional) and performance (materialzed denormalized structures) views into that world. I’m not being sarcastic; I model most of my customer implementations off the CIF and think it’s a good approach from a TCO perspective.

The key takeaway remains: if the data isn’t integrated, it won’t be useful. An EDW promotes this, but it’s not the only way. You start to realize more value as the richness of relationships and entities increase in the integrated view.

One of the things I have a beef with is that the “Semantic Layer” (metadata for dimensional modeling, data freshness, etc) can be used instead of ETL and building physical star schemas. I make no issue that the reporting tools, database, and platform can adequately do this, but rather how is it managed? For example, if I define my dimension LOGICALLY, and let the REPORTING tool build a cross tab based on that dimension that should work. BUT, how is that managed as part of the information lifecycle? I’ve seen VERY few tools that can tell you: on day X I was generating this dimension this way, and provided it to these 20 reports using this particular method. ETL tools building PHYSICAL structures are usually managed (think source code, or some sort of build and release system). In other words, if you see a report based on the “CUSTOMER COUNTRY” and a date one can say PRECISELY how that was generated because there’s a managed solution (ETL, Database Structures) in a repository somewhere that tell you what your logical and physical ETL were at that point in time. Good luck doing that when someone is able to change this on the fly in a clever “report writing” tool.

Sorry Discoverer gurus… I’ve never been a fan of “faking” real dimensional structures with clever SQL generation. Not because it doesn’t work or won’t peform, but the management life cycle of reporting tools and configuration are ages behind the ETL tools. Not saying they’re great, but… you get the point.

Overall I enjoyed Stephen’s presentation. GREAT SPEAKER, actually! My favorite line from the day: “Data Marts are kind of like rabbits in the data center. They just start multiplying!.” 🙂

DAMA-PS March 2nd

I’ve been a member of DAMA-PS since I moved to Seattle in 2004. I wasn’t able to make last years DAMA day but I’m looking forward to DAMA day 2006 in Seattle. If you’re in the area, check it out:

Morning Keynote:
Stephen Brobst
Best Practices in Enterprise Meta Data Management
and Data Warehouse Deployments

This session provides a taxonomy of data warehouse
topologies and discussion of best practices for enterprise
data warehouse deployment. Characterization
of performance, total cost of ownership, and business
functionality will be used to describe tradeoffs
among various choices in topology and architecture
deployment. Implementation techniques using integrated,
federated, and data mart architectures will
be discussed as well as deployment of four distinct
classes of meta data (end user, design technical and
semantic) which will be described in the context of
creating a single source of truth for enterprise decision
making across multiple lines of business- and
functionally-oriented organizational boundaries.

Afternoon Keynote:
David Loshin
Master Data Management and Data Standards:
Building From Consensus

The hot topic these days is master data management,
or being able to capture and manage reference
data as a shared corporate asset that
feeds into both production operational and analytical
applications. However, in the absence of
an agreement as to the semantics of the data
objects being “master-managed,” the perpetual
problems of misunderstanding the data will infiltrate
your applications. Developing a master
data management program provides an opportunity
for the business and technical teams to
discuss and agree to standards for the structure,
form, and most importantly, meanings of the
data elements to be managed. In this session,
we’ll discuss using a data standards approach
to successfully support a master data management
program.