Category Archives: Pentaho

Pentaho Fat Clients: Breaking into Double Digits

Business Intelligence is a complex diverse space. There’s a bunch of technologies that typically need to be combined together to get a comprehensive, end to end solution.

One of the things that I believe is confusing for users of Pentaho is the sheer volume of clients that are available to “quickly and easily” build your solution. The quickly and easily is predicated on the fact that if you need to build a “prompt” for a report, you know which of the fat clients to fire up. Want to dynamically hide a field? In order to do that you have to know that’s in a different fat client.

I know of at least 10 different good ole fashioned, download and install to your desktop clients that you’d use if you were doing a full, soup to nuts everything used Pentaho installation.

  • Design Studio
  • Report Designer
  • Report Design Wizard
  • Mondrian Workbench
  • Pentaho Metadata Editor
  • Spoon (Kettle)
  • Cube Designer
  • Weka Explorer
  • Weka Experimenter
  • <<new fat client Pentaho hasn’t announced yet>>

This is no easy challenge to solve for Pentaho. Part of the open source mantra includes making each of the individual projects (Kettle/Mondrian/Weka/etc) useful on their own, without some big Pentaho installation. What that means is a challenge to make a UI/designer/etc that works “standalone” but could also be included in some master development environment? That’s tough, and to date Pentaho has made only modest steps at this (Wizard inside of Designer).

I have no good advice for Pentaho in this regard. There’s a very good reason for keeping them as separate installations and I think it shows respect to the individual communities. However, this is an issue for people coming to Pentaho as a full BI suite. Does anyone have any good ideas on how to solve this pickle of a problem? We should all help Pentaho with this as it benefits everyone to come up with a good way to approach the development tools (as a suite and as individual products).

PS – My $HOME/dev/pentaho directory is littered with old installations. Every time Pentaho goes from 1.6.0 GA to 1.6.1 GA the only way to ensure you’re getting the correctly matched versions is to upgrade all those clients.

bayon is back

For readers who have been perusing since the early days of this blog (bayon blog) you’ll know what I’m talking about. If you’re a reader that has joined in the past year and half you’re probably wondering “What is bayon?”

bayon is a boutique consulting firm specializing in Business Intelligence implementations; it’s my company that I’ve operated since 2002. I put it on the back burner when I put on a Pentaho jersey and played a few games on the Pentaho team. I’m leaving (actually, left) Pentaho. My time at Pentaho was great. The Pentaho tribe is a great group of kind, honest, smart people. Rare to find the intersection of good people and good technologists.

I’ve felt the siren call of helping customers in a more entrenched way. Consulting does that I think. So, not like it’s a big announcement, but it is belated as my last day at Pentaho was nearly two months ago:

I’m now working at bayon full time building a dedicated practice around Open Source BI technologies in the enterprise. Bayon has joined the Pentaho partner program as a Certified Systems Integrator.

So there you have it. Shingle is out.

If you are interested in Pentaho, Open Source ETL, Open Source BI, etc don’t hesitate to be in touch.

PS – It’s also worth noting that my leaving has no reflection on the progress of the business. Quite the opposite really; some would consider me foolish for leaving when the company is doing as well as it is!

Using Kettle for EII

Pentaho Data Integration (aka Kettle) can be used for ETL but it can also be used in EII scenarios. For instance, you have a report that can be run from a customer service application that will allow the customer service agent to see the current issues/calls up to the minute (CRM database) but also give a strategic snapshot of the customer from the customer profitability and value data mart (data warehouse). You’d like to look a this on the same report that with data coming from two different systems with different Operating Systems and databases.

Kettle can make short work of this using the integration Pentaho provides and the ability to SLURP data from an ETL transform into a report without the need to persist to some temporary or staging table. The thing that Pentaho has NOT made short work of, is being able to use the visual report authoring tools (Report Designer and Report Design Wizard) to be able to use a Kettle transform as a source for the report during design time. That’s an important point worth repeating.

As of Pentaho 1.6, Pentaho provides EII functionality at RUNTIME but NOT at DESIGNTIME.

So, you can use an ETL transform as the source of a report, and there two examples of that. In the samples/etl directory that ships in the Pentaho BI Suite demo or you can see another example in an earlier blog entitled “Simple Chart from CSV“.

What is the best method for building reports that are going to use this functionality?

I, like others who use the Pentaho product suite, would like to use the Report Designer to build my report visually but have the data actually coming from an EII transformation. This blog is about those steps.

Step 1. Create your data set

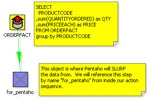
Build an ETL transformation that ends with the data you want to get on your report. Use several databases, lookups, calculations, excel files, whatever you want. Just get your data ready (use the Preview functionality in Kettle). You’d do this with Kettle 2.5.x if you want to deploy into Pentaho 1.6. I’ve created a simple ETL transformation that does something absurdly simple: generate summary sales figures by product.
200708151622
Step 2. Add a table output step to the transformation

What we’re going to do now is create a table that we’ll use ONLY during design time to build our report. Just use any database that you have access to while designing the report (MySQL or Oracle XE on your local machine?). Add a table output step to the transformation and click on the “SQL” button to have it generate the DDL for the table. Go ahead and execute the DDL to create your temporary table that we’ll use for designing our report. Name the table something silly like MYTEMPTABLE.
200708151624
200708151627

Step 3. Execute the mapping and populate the temporary table

Hit run and get data into that table. Now we have a table, MYTEMPTABLE that has the format and a snapshot of data we want to use for building our report.

Step 4. Write your report using the temporary table as a source

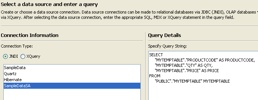
Open up Report Designer. Run through the wizard (or the Report Designer) as usual and build your report (with groupings, logos, images, totals, etc) just like you normally would. You will use the MYTEMPTABLE in your temporary database as your source for this report.
200708151631

Nothing spectacular yet. All we’ve done is write a basic report against a basic table.

Step 5. Publish your report to Pentaho server and test

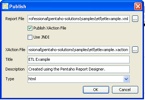
Using Publish (or Publish to Server) in the Pentaho Report Designer publish the report to the server so you can execute your report from the web using Pentaho. In this example I published the report to samples/etl so it’s alongside the example that we shipped with Pentaho demo server.
200708151634

Let’s make sure that report showed up.
200708151635

Great. Let’s click on it to make sure the report runs.
200708151636

Ok. Our report (etlexample.xaction) runs inside of Pentaho. Again, at this point we’ve not done anything spectacular this is just a basic (read Ugly basic grey/white) report that just selects data from MYTEMPTABLE.

Step 6. Copy transformation so it’s beside the report

It’s not REQUIRED but it’s a very good idea to DISABLE the hop from the for_pentaho step and the table output. When we run this report now we don’t actually want to do any INSERTS into a table. If we disable the hop after for_pentaho then the transformation does ZERO DML.

The ETL transformation can really be anywhere, but it’s good practice to put the transformation (.ktr file) alongside the report. Copy the kettleexample.ktr file (from Step 1) to samples/etl so that it is sitting alongside etlexample.xaction.

Step 7. Swap from Relational to Pentaho Data Integration.

You could make the change directly to the .xaction to get it to source data from the Kettle transform. However, I’m going to copy etlexample.xaction to etlexample2.xaction just so that I can see both running side by side.

In Design Studio, copy etlexample.xaction to a new action sequence etlexample2.xaction.

Open up etlexample2.xaction and make the following changes.

First, change the name of the action sequence from ETL Transformation to ETL Transformation – NO TABLE
200708151647

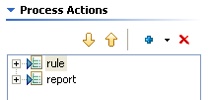
Second, remove the “relational” data that is producing the data for the report by highlighting the step named “rule” and then hitting the RED X to remove it.
200708151649
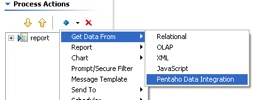
Third, add a Get Data From Pentaho Data Integration step ABOVE the report step.
200708151651

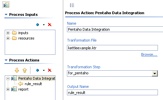
Fourth, configure the Pentaho Data Integration as follows.
200708151650

Some notes about what we’ve just done there. We’ve told it the name of the Kettle transformation we’d like to use to get our data is kettleexample.ktr. There are two other important pieces of information we’ve filled in on that screen as well. We’ve told the component that we’ll get our data (rows) from the step named “for_pentaho.” The component will SLURP data from that step and stream it into the result. The other piece of information we’ve given to the component is what we want to name the result set so that the report knows where to get the results. Name the result set “rule_result.”

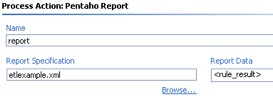
Finally, highlight the report step and make sure that the report is getting its data from “rule_result” but we shouldn’t have to change anything else about the report. Just where it was getting its data.
200708151658

Step 8. Test your EII version of your same report

Navigate to find your new report you created that uses the Kettle ETL transformation INSTEAD of the table.
200708151658-1

Click on ETL Example – NO TABLE and you should see the same data/report.
200708151659

This report is NOT using MYTEMPTABLE and is instead, peering inside of kettleexample.ktr and getting its data from “for_pentaho” and generating the report.

Congratulations! You now have a method that you can use to create EII reports using the same visual tools as when normally developing against a relational source. Imagine the possibilities…. what you can do in Kettle (pivot, unpivot, lookup, calculate, javascript, excel, flat file, web service, XML streaming, call database procedures, and on and on and on) you can do for your reports.

Feedback welcome. The zip file for this example here. I built this example on 1.2 Demo Server GA but should work on 1.6 as well. All you need to do is unzip the file above into pentaho-demo/pentaho-solutions/samples/etl and you should have another working example.

Kettles secret in-memory database

Kettles secret in-memory database is

  1. Not actually secret
  2. Not actually Kettles

There. I said it, and I feel much better. 🙂

In most circumstances, Kettle is used in conjunction with a database. You are typically doing something with a database: INSERTs, UPDATEs, DELETEs, UPSERTs, DIMENSION UPDATEs, etc. While I do know of some people that are using Kettle without a database (think log munching and summarization) a database is something that a Kettle developer almost always has at their disposal.

Sometimes there isn’t a database. Sometimes you don’t want the slowdown of persistence in a database. Sometimes you just want Kettle to just have an in memory blackboard across transformations. Sometimes you want to ship an example to a customer using database operations but don’t want to fuss with database install, dump files, etc.

Kettle ships with a Hypersonic driver, and therefore, has the ability to create an in memory database that does (most) everything you need database wise.

For instance, I’ve created two sample transformations that use this in-memory database.

The first one, kettle_inprocess_database.ktr, loads data into a simple table:
200706202230

The second one, kettle_inprocess_database_read.ktr, reads the data back from that simple table:
200706202235

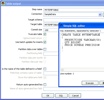
To setup the database used in both of these transformations, which has no files, and is only valid for the length of the JVM I’ve used the following Kettle database connection setup.

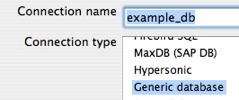
I setup a connection named example_db using the Generic option. This is so that I have full control over the JDBC URL.
200706202227

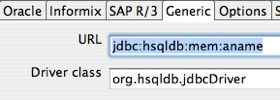
I then head to the Generic tab and input by URL and Driver. Nothing special with the driver class, org.hsqldb.jdbcDriver that is just the regular HSQLDB driver name. The URL is a little different then usual. The URL provided tells hypersonic to use a database in-memory with no persistence, and no data fil.e”
200706202225

Ok, that means the database “example_db” should be setup for the transformations.

Remember, there is NOTHING persistent about this database. That means, every time I start Kettle the database will have no tables, no rows, no nothing. Some steps to run through this example.

  1. Open kettle_inprocess_database. “Test” the example_db connection to ensure that I / you have setup the in-memory database correctly.
  2. Remember, nothing in the database so we have to create our table. In the testing table operator, hit the SQL Button at the bottom of the editor to generate the DDL for this smple table.
  3. Run kettle_inprocess_database and verify that it loaded 10 rows into testingtable.
  4. Run kettle_inprocess_database_read and verify that it is reading 10 rows from the in-memory table testingtable.

I should note that using this approach isn’t always a good idea. In particular there’s issues with memory management, thread safety, it definitely won’t work with Kettles clustering features. However, it’s a simple easy solution for some circumstances. Your mileage may vary but ENJOY!

Kettle ETL Jobs over the Internet

Kettle recently switched over from accessing the file system via standard Java libraries to using the Apache VFS libraries. So what does that mean? Why does that matter? Well, it really opens up a whole slew of deployment options, and provides even more options for managing Kettle code. You can now manage your actual ETL jobs and transforms in Zipfiles, on Web Servers, FTP servers, WebDav locations, etc. Basically, you can making Kettle even thinner than it is right now.

For instance, you can now run Kettle ETL jobs with ONLY the base Kettle installation and a remote URL. Consider the following example.

I have two Kettle jobs:

http://www.nicholasgoodman.com/kettle/parentjob.kjb
200705281727

-AND –

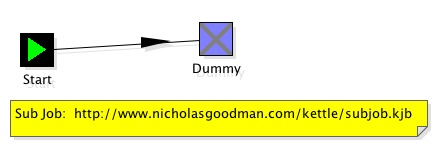
http://www.nicholasgoodman.com/kettle/subjob.kjb
200705281729

The parent job, does something very simple: It executes the subjob.kjb using relative addressing. You can use the well known and supported ${Internal.Job.Filename.Directory} variable so that you don’t have to hard code the physical location of another jobs/transform/datafile/etc. In this case, it doesn’t matter if the subjob is on the local file system or on a webserver. The dialog to setup the relative addressing looks like this:

200705281733

Now, using nothing but the standard Kettle 2.5.0 download I can execute these two jobs without any client side ETL Jobs or Transforms.

./kitchen.sh -file=http://www.nicholasgoodman.com/kettle/parentjob.kjb

17:42:30,075 INFO [Kitchen] Kitchen – Start of run.
17:42:30,644 INFO [Kettle] Kettle – Reading repositories XML file: /Users/ngoodman/.kettle/repositories.xml
17:42:30,647 ERROR [Kettle] Kettle – Error opening file: /Users/ngoodman/.kettle/repositories.xml : java.io.FileNotFoundException: /Users/ngoodman/.kettle/repositories.xml (No such file or directory)
ERROR: No repositories defined on this system.
2007/05/28 17:42:30:695 PDT [INFO] DefaultFileReplicator – Using “/tmp/vfs_cache” as temporary files store.
17:42:31,991 INFO [Thread[parentjob (parentjob (Thread-2)),5,main]] Thread[parentjob (parentjob (Thread-2)),5,main] – Sleeping: 0 minutes
17:42:31,992 INFO [parentjob] parentjob – Starting entry [subjob]
17:42:32,133 INFO [Thread[subjob (subjob (Thread-3)),5,main]] Thread[subjob (subjob (Thread-3)),5,main] – Sleeping: 0 minutes
17:42:32,134 INFO [subjob] subjob – Starting entry [Dummy]
17:42:32,135 INFO [subjob] subjob – Finished jobentry [Dummy] (result=true)
17:42:32,233 INFO [parentjob] parentjob – Starting entry [Dummy]
17:42:32,234 INFO [parentjob] parentjob – Finished jobentry [Dummy] (result=true)
17:42:32,234 INFO [parentjob] parentjob – Finished jobentry [subjob] (result=true)
17:42:32,235 INFO [Kitchen] Kitchen – Finished!
17:42:32,235 INFO [Kitchen] Kitchen – Start=2007/05/28 17:42:30.630, Stop=2007/05/28 17:42:32.235
17:42:32,235 INFO [Kitchen] Kitchen – Processing ended after 1 seconds.

Just another nice feature that allows even more interesting ways to manage a deployment of ETL jobs and Transforms. Great work Kettle team!

MySQL Archive Tablespace for FACTs

I’m visiting a Pentaho customer right now whose current “transaction” volume is 200 million rows per day.  Relatively speaking, this puts their planned warehouse in the top quintile of size.  They will face significant issues with load times, data storage, processing reliability, etc.  Kettle is the tool they selected and it is working really well.  Distributed record processing using Kettle and a FOSS database is a classic case study for Martens scale out manifesto

This organization doesn’t have unlimited budget.  Specifically, they don’t have a telecom type budget for their telecom like volume of data.  One of the issues that has come up with their implementation has been the tradeoff between space, and keeping the base level fact records.  For example, at 200 million / day and X bytes per fact you start to get into terabytes of storage quickly.  It was assumed, from the start of the project, only summary level data could be stored for any window of time exceeding 10 days or so. 

The overall math is sound. 

Size per record (S) x number of records per day (N) = size per day of data growth (D)

In this equation, there’s really not much we can do, if we want to keep the actual base level transaction, about the number of records per day.  N becomes a fixed parameter in this equation.  We do have some control over the S value, which is mostly about what this blog is about.

Can we reduce the size of S by such an amount that D becomes more realistic?  The answer is the ARCHIVE engine in MySQL.

I created the DDL for a typical fact record.  Few Dimension IDs and a few of numeric values.

CREATE TABLE test_archive
(
  DIM1_ID INT
, DIM2_ID INT
, DIM3_ID INT
, DIM4_ID INT
, DIM5_ID INT
, NUMBER1 FLOAT
, NUMBER2 FLOAT
, NUMBER3 FLOAT
, NUMBER4 FLOAT
) engine=ARCHIVE
;

I did this in MyISAM as well

CREATE TABLE test_myisam
(
  DIM1_ID INT
, DIM2_ID INT
, DIM3_ID INT
, DIM4_ID INT
, DIM5_ID INT
, NUMBER1 FLOAT
, NUMBER2 FLOAT
, NUMBER3 FLOAT
, NUMBER4 FLOAT
) engine=MyISAM
;

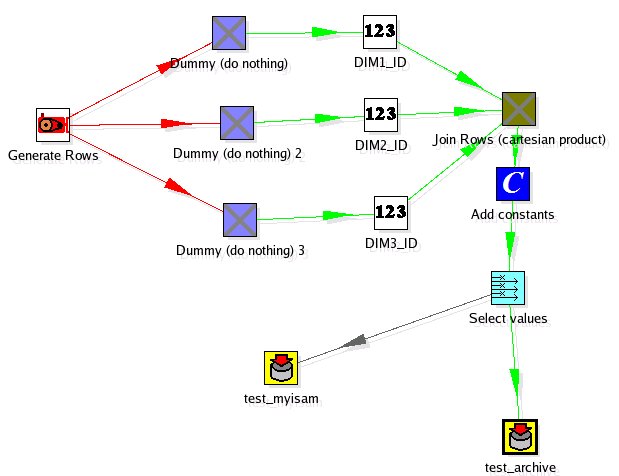
I used a simple Kettle transformation to populate both the these tables with 1 million rows of data. It wasn’t scientific but the INSERT performance of the Archive and MyISAM tables were very similar (within 10% of the throughput of rows).

So now we have a million rows, with a reasonable FACT record format.  How much space do these 1 million rows require to store?

+--------------+---------+---------------+------------+
| table_name | engine | total_size_mb | table_rows |
+--------------+---------+---------------+------------+
| test_archive | ARCHIVE | 2.63 | 1000000 |
| test_myisam | MyISAM | 36.24 | 1000000 |
+--------------+---------+---------------+------------+

The Archive table uses an order of magnitude LESS space to store the same set of FACTS.  What about query performance?  I’ll have to do another blog on a more scientific approach but the anecdotal query performance on typical OLAP queries (select sum() from fact group by dim1_id) seemed related (less than a 15% difference). 

Let’s be clear here, one MUST have a good aggregate table strategy so the fact records are RARELY accessed because the performance will not rock your world.  However, this is the case with these volumes anyhow.  Summaries and Aggregates have to be built for the end user to have a good experience on the frond end.

Archive engine is strange. INSERT/SELECT only.  You can’t do ANYTHING with it, except drop and recreate it.  For historical fact loads on “settled” DW data segmented on a daily basis this is usually not an issue.  No transactions need, no DML needed.  I’d also like to see how this compares to “packed” MyISAM tables at some point.  I’m guessing I wouldn’t expect to see it beat the compression in terms of storage space, but there’s some nice things you can do with MyISAM tables (for instance, MERGE).

Back of the napkin calculation to handle BIG data volume:

2.63 MB / million * 200 per day = 526 MB / day
526 MB / day * 365 days = 187.5 GB

Anyone else have fun experiences to share with the Archive engine?

Side Note:
  I did all this testing on a VNC Server enabled EC2 instance I use for testing.  Fire it up, VNC in, do my testing, shut it down.  I LOVE EC2!

Meet me in San Francisco: Pentaho Training

I am going to be the instructor for the Operational Business Intelligence course in April.  This particular course digs into the reporting tools, scheduling, processes, design, etc.  Basically, everything you need to build a reporting-centric solution using Pentaho.

Operational Business Intelligence – San Francisco, CA

303 Twin Dolphins Drive
Suite 600
Redwood City, CA  94065
USA
Monday, April 23, 2007 – Thursday, April 26, 2007

I’m curious: if you signup for the course having learnt about it here, put in the notes that was the case.  I’ll bring a special Pentaho shwag gift to anyone who signs up from this blog readership in the next two weeks!

PS – I know I know.  Redwood City isn’t technically SFO but … whatever!

Pentaho 1.2 goes GA

Last December Pentaho released it’s first certified, Generally Available product. In the past year there has been an astounding number of features added to the platform. Those who keep up with the open source releases (approximately every 6-8 weeks) have been able to watch the progression piecemeal.

Pentaho announced today the General Availability of Pentaho 1.2 which represents nearly one year of Pentaho (and community) contribution.

The past 3 months Pentaho and the community at large have widdled down Bugs, hiccups, issues, etc with all this new code and arrived at something suitable for production. Pentaho users (customers and community alike) have a set of bits they can feel pretty confident using. I’m proud of this effort, and wish to congratulate all those who submitted (or fixed!) Bugs. One of the things I love about open source: everyone benefits greatly from small acts of contribution.

Happy Holidays and Thank You!

Simple Chart from CSV File

There was some requests on the Pentaho Data Integration forums for an example of how to generate a simple chart from a CSV file.

Sometimes people get so lost in the technology, that it’s tough to just do something pretty simple.  I totally get that.  Pentaho still has plenty of room for improvement on the usability, especially for people coming to the platform for the first time.

Well, here tis.

Unzip examplecsv.zip to pentaho-demo/pentaho-solutions/samples/etl/ in the sample server.

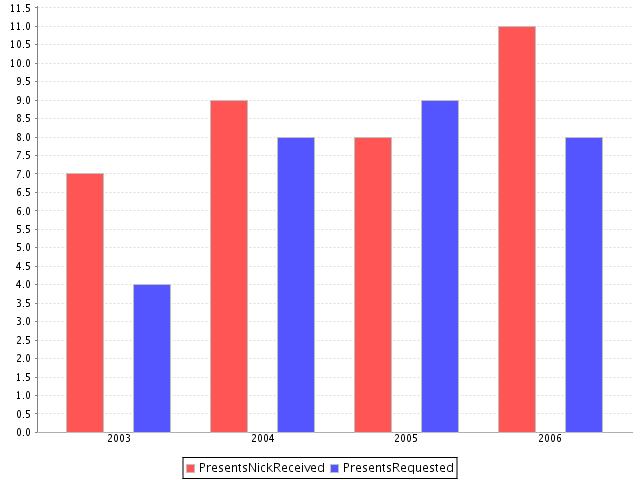
Basically, the idea is to turn a csv file (example.csv):

Year,PresentsNickReceived,PresentsRequested
2003,7,4
2004,9,8
2005,8,9
2006,11,8

into this chart

The confusing part, I’m guessing from the thread, was how data gets from KETTLE to PENTAHO.

Not hard at all actually.

Pentaho initiates (ie, calls Kettles API) the Kettle transform and then “slurps” in memory records from a specified step.  It’s the UNIX equivalent of the “tee” utility where you’re just watching data arriving at a certain place.  In this example, I’ve made it even more explicit by naming the “dummy” step “for_pentaho” so that it’s clear the step that Pentaho is “slurping” the data from.

After that, it’s just a matter of building a chart like any other in the platform.