Pentaho, being a family orientated company, is big on kids holidays. The design team dropped an easter egg on our homepage today.
Can you find it?
Pentaho, being a family orientated company, is big on kids holidays. The design team dropped an easter egg on our homepage today.
Can you find it?
One of the things I love to do, is connect with fellow bloggers and chat over mutual interests. It sounds silly, since there are like 100 million blogs or something, but there’s a certain camaraderie and shared identification amoungst bloggers. I’ve always had fantastic meetups from the UK to OZ to the good ole USA.
While in Sydney I had the good fortune to connect with the folks behind the product, BI Documenter. John, Richard, and Cyril are the principals involved in building what looks to be a sweet little product. It’s a great concept: collect and process the metadata from SQL Server, MSAS, Integration Services, Reporting Services and build some useful documentation about your BI Solution.
They have a live set of these docs here: http://www.bidocumenter.com/Sample/Index.htm
but here’s a snapshot of the main table of contents once its done its slurping.
How many times have we wanted shoot ourselves when the business users ask some simple, straightforward questions about their reports because we’ve explained it about one hundred times. Does net sales take into account product returns? If you’re a MSFT (grumble) solution, you don’t have to answer these questions again and again and again and again. You can provide documentation that will provide these answers for your users. From what I saw, the navigation will be very familiar and similar to a “Help” system.
I can’t tell you how many more times the $$ of their license I would pay to have this for past Oracle engagements. If you’re a MSFT shop, definitely check them out. They even have a FREE VERSION which works on just one data source (SQL Server).
Disclosure: I haven’t used it, and probably won’t because my day to day life keeps me in non-MSFT BI land.
This is a common situation: Don’t show me what my total sales figures were month after month, show me something that describes something important to my business. ie, Sales Growth
Chris Webb, who runs a wildly popular MSFT blog in addition to being an in demand independent consultant, wrote an article on Previous Period Growth using Pentaho. Mondrian (Pentaho Analysis Server) uses MDX, a powerful expressive multidimensional query language which Chris is one of the leading experts on its practical use and applications.
Chris outlines how to build a “custom” calculated measure that displays the Sales Previous Period Growth:
All you need is the zero install pentaho demo installation to run through his tech tip, available at http://www.pentaho.org/download/latest.php
Remember, this isn’t trivial (ie, writing MDX fragments) but it’s VERY VERY powerful. Check out the Mondrian MDX reference here for some of the powerful analytic calculations available. Remember, once you’ve got your MDX member working properly HIDE that complexity from your users by adding it to the Mondrian OLAP schema definition.
I had the recent good fortune of traveling to Sydney to deliver a “much sought after” scheduling of our “Building Analytic Solutions with Pentaho” class. We did little advertising but it was packed (12 people, the maximum we ever do for public classes).
I love doing training courses for more advanced topics, like the Analytic solutions course. I love it because it’s a chance to converse with other practitioners and share knowledge, experience, and war stories. These experiences, and the camaraderie is invaluable when one tends to be the “lesser known” topics at an organization. It’s GREAT to hear about open source adoption in the enterprise; stories of countless millions being saved, people feeling empowered to make their infrastructure and applications what THEY want instead of what their VENDORS want. It’s just nice to connect with people of similar interests.
It’s also a chance to hear some validation for strong points and deficiencies in Pentaho’s open source strategy. I have my own opinions, as someone who uses the software day in day out on real customer problems. It’s great to hear that others either feel the same way or disagree; because that’s the nature of this community driven process. It doesn’t really matter what I think the product should be like (I work for the vendor right?) it matters what customers and community want. I think feature X is awful, doesn’t work properly and is total crap. OK. If community members find it entirely suitable for their needs, and say “Go work on feature Y” then that’s PERFECT.
This is the most effecient part of open source: The closer you are to your customer, the closer you are to your market, the closer you are to the pain or joy, the more likely you are to make better product. Cutting out the middle men (in many cases, account managers and product managers and development managers, etc).
Thank you, Sydney trainees for sharing your praises and criticisms. I’ll bring them to those that can actually do something about it (ie, Java Jockeys).
PS – Based on the training people like more of our product than dislike AND I was right about Feature X. 🙂
Our good friends at BreadboardBI have just released a solution to provide a common web analytics and reports. While that, in and of itself, isn’t that earth shattering because there’s several FOSS projects that do this, what IS compelling is that it’s a Pentaho solution. This picks up where the others leave off; the ability to build your own custom reports, extend the solution with another dimension or fact. Add some of your own views, deliver the reports via email, etc.
Check out the project and some of the features at BreadboardBI and sourceforge. Here are some screenshots from their application; there’s some cool stuff in there!
Including a bunch of “OLAP views” so that users can filter, slice and dice, and search for information on their own.
I think we’re going to see more of these “solutions” pop up over time. We just released the Software Quality for Bugzilla two weeks back, BreadBoardBI just released their Web Analytics project, OpenBI have a set of templates “OpenQuick Suite” they use for consulting gigs, Proratio with their SAP Connector, etc. I’ll venture to say that our growing partner base is maturing in the sophistication of their services; with services partners exceeding “pure play” consulting and including some solutions and rapid starts that help deliver even MORE value on top of Pentaho.
I’ve been working, on and off, for the past few months on a solution that really pulls together most of the major functions of our platform into an entire solution. The SQR uses a little bit of the entire Pentaho Platform including Action Sequences, Kettle ETL, database structure initialization, Mondrian OLAP definitions, summary tables, JFreeReports, Pentaho Analysis views, user prompting, custom report rollups in Excel, etc. It looks, feels, and operates as an entire solution, soup to nuts, running on Pentaho.
The SQR doesn’t aim to replace reports provided with Bugzilla. Bugzilla is a good database schema for running an application (ie, Bugzilla) but it’s sometimes difficult if not impossible to ask some important analytic questions. Questions such as: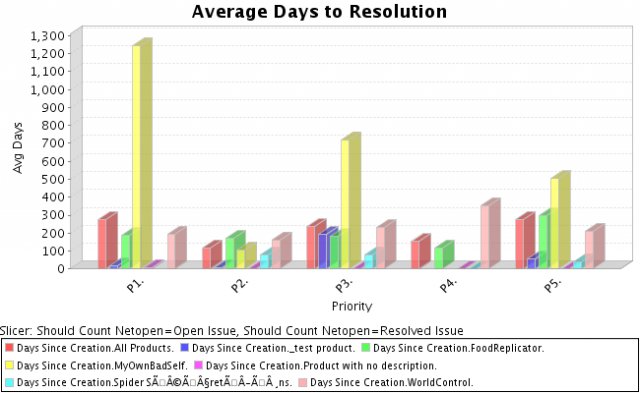
and “Open vs Closed with a trend over time”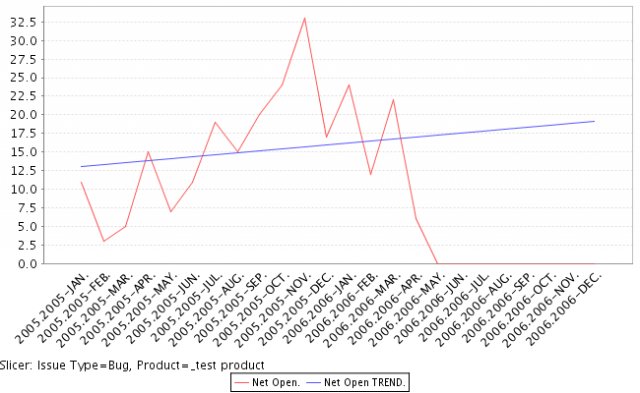
and the ability to build some of your own dashboards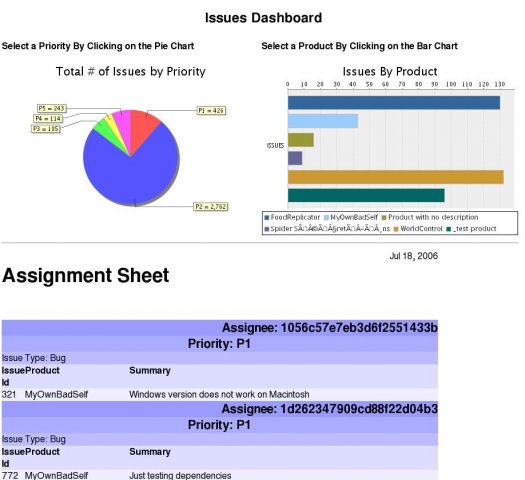
The solution comes with sample data, provided graciously by landfill.bugzilla.org, and a bunch of sample reports, etc. Over the coming months I’ll cover bits and pieces of the solution of which there are some great “how to” gems in there on how to roll out an entire, integrated solution on Pentaho.
If you use Bugzilla, definitely download and check out the solution; you may find some very useful reports and insight into your engineering process and software quality.
If you use Pentaho, stay tuned to this blog. I’ll cover some of the “Pentaho” specific stuff using it as a standard downloadable reference.
Let me know what you think!
Our good friends at MySQL and Pentaho are hosting a webinar about ETL for MySQL using Pentaho Kettle.
ETL is a multipurpose technology, from straight data integration to data migration to reporting systems. Kettle is primarily used in building Data Warehouse/Data Marts but can also be used for doing other useful MySQL admin tasks.
Matt Casters and Lance Walter will give you the low down on Kettle:
http://www.mysql.com/news-and-events/web-seminars/etl-using-pentaho-kettle.php
I recommend it, even if you’re not interested in MySQL. You’ll be surprised that an Open Source ETL tool is so visual and easy to use you may consider it for all kind of tasks.
My soon to be wife and I got totally HOOKED on Lost.
Season 2 was just released on DVD and we’ve picked it up from our local Target at a bargain price. Now the tough part is, with a mad amount of work and a wedding to prepare do we have the willpower to resist?
I’m getting married in just under two weeks!
So very excited about a hundred or so people from all over the world flying to Lake Crescent here in Washington state. It’s a lot of work and we’re coming down the home stretch. If I appear to be “missing” for the next few weeks it is, well, because I AM! I’ll be working like made wrapping up some work at Pentaho and then off for a couple of weeks for the wedding.
September will likely be pretty “dark” on the blog…
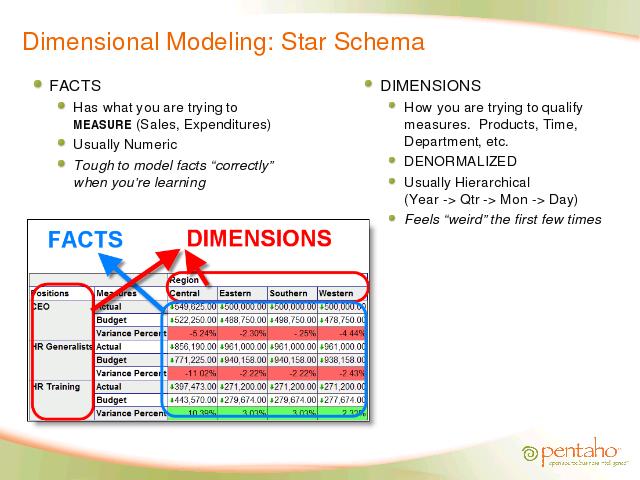
Back in May Dan Morgan was kind enough to invite me to do a guest lecture at the University of Washington about “Data Warehousing Basics.” After having emailed these slides as a decent overview to a few customers lately, I realized they’d probably be useful online. It is obviously a little light on content (their just slides) but they do provide some good “high level views” of dimensional modeling/DW/BI in general. My employer, Pentaho, was generous enough to allow me time to build this presentation for the students at UW for which they, and I are grateful. THANK YOU!
The online version: Univerisity of Washington Guest Lecture May 9
The PDF of the presentation: University_of_Washington_Guest_Lecture_May_9.pdf
My cliffs notes:
- If you’re doing a BI or DW project find “that guy” with the MS Access database or Excel jockey that sits outside the COO’s office. Make him your BEST BEST friend.
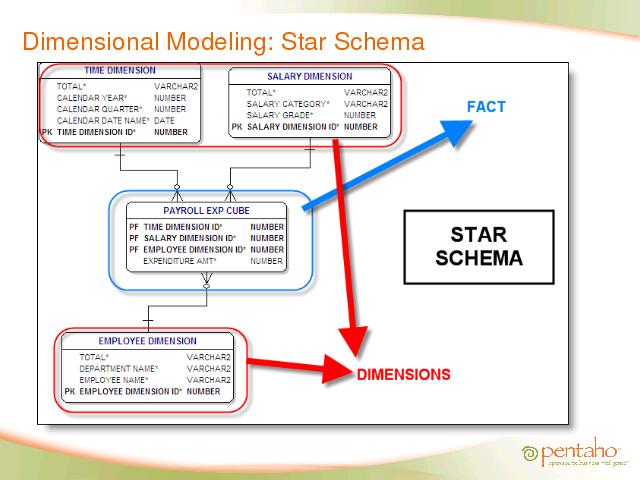
- Facts are “What” / Dimensions are “How” Good graphics that drive the point home:
and
Thanks to Matt Casters for leeting me pillage some of his graphics and slides.