Ohhhh… Rocketboom

Rocketboom is beamed to my Tivo regularly. Cool feature and I think it’s a glimpse into the future as well. No cable company, no networks, just content provider and an API to zip it to my Tivo.

Anyhow todays Rocketboom was both odd, and amusing. Usually it’s all business, but crazy day today. 🙂

DAMA-PS Session: Forget Federated

I had listen to Stephen A. Brobst, CTO at NCR Teradata about “Best Practices in Meta Data Management and Enterprise Data Warehouse Deployment” this morning. I was hoping to grok some details about new metadata management techniques, but what the presentation was much more focused on the “deployment/architecture” side. That being said, I think it was MUCH more useful for the the audience as a whole to cover the deployment in as much detail; I personally didn’t find it all that groundbreaking.

Summary: Build an EDW based on a 20,000 ft blueprint, integrate your data into a single location (say, perhaps, a massively scalable single system image shared nothing database) using a relational schema, build a subject area at a time, and star schemas only when performance is an issue. Clearly the architecture is advocating the Oracle/Teradata/etc view of the world that says ONE GIGUNDOUS RELATIONAL warehouse with various semantic (dimensional) and performance (materialzed denormalized structures) views into that world. I’m not being sarcastic; I model most of my customer implementations off the CIF and think it’s a good approach from a TCO perspective.

The key takeaway remains: if the data isn’t integrated, it won’t be useful. An EDW promotes this, but it’s not the only way. You start to realize more value as the richness of relationships and entities increase in the integrated view.

One of the things I have a beef with is that the “Semantic Layer” (metadata for dimensional modeling, data freshness, etc) can be used instead of ETL and building physical star schemas. I make no issue that the reporting tools, database, and platform can adequately do this, but rather how is it managed? For example, if I define my dimension LOGICALLY, and let the REPORTING tool build a cross tab based on that dimension that should work. BUT, how is that managed as part of the information lifecycle? I’ve seen VERY few tools that can tell you: on day X I was generating this dimension this way, and provided it to these 20 reports using this particular method. ETL tools building PHYSICAL structures are usually managed (think source code, or some sort of build and release system). In other words, if you see a report based on the “CUSTOMER COUNTRY” and a date one can say PRECISELY how that was generated because there’s a managed solution (ETL, Database Structures) in a repository somewhere that tell you what your logical and physical ETL were at that point in time. Good luck doing that when someone is able to change this on the fly in a clever “report writing” tool.

Sorry Discoverer gurus… I’ve never been a fan of “faking” real dimensional structures with clever SQL generation. Not because it doesn’t work or won’t peform, but the management life cycle of reporting tools and configuration are ages behind the ETL tools. Not saying they’re great, but… you get the point.

Overall I enjoyed Stephen’s presentation. GREAT SPEAKER, actually! My favorite line from the day: “Data Marts are kind of like rabbits in the data center. They just start multiplying!.” 🙂
Off Topic: Two G's

UPDATE: Some people have emailed asking if everything is alright. Overall the changes are very positive but thanks for all those concerned!
UPDATE 2: My 95% figure was apparently, grossly incorrect. Assuming you are an IT making more than 35000 GBP, or 62000 USD, or 52000 EUR annually you are in the richest 99% of the world. Once again… we are so very fortunate, collectively. Happy to update and correct it here! 🙂

My life is changing… some professional aspects and personal aspects. Emotions are a part of life and I’ve been facing rational and irrational emotions and thoughts about change. I’m excited and anxious all at once…

And you want to know what? Gratitude and genorosity are the most POWERFUL soothing emotions.

Grateful that you have a roof over your head, food in your cabinet, health, loved ones, and the opportunity to chase dreams professionally. The human condition longs for wanting more, but being thankful for what you have is a powerful idea. Humbling and potent!

Genorosity, or giving with no thought of return, speaks to us all as human beings. Giving some time to strangers in need, random acts of kindness, etc.

So… if you’re reading this blog you are likely an IT professional interested in Oracle, Data Warehousing, Business Intelligence or Open Source; you are better off financially than 95(99)% of the people on planet earth. Consider taking 30 seconds that you spent reading this blog and explore the things you are grateful for. I bet you’ll feel better with that knowledge than any OWB trick or Open Source BI insight you could have grokked in the same 30 seconds.

And now… we return you to regularly scheduled programming.

SugarCRM, the elephant in the room?

I’m constantly amazed at how no one calls SugarCRM on their deceptive open source license. Cliffs Notes: They call it open source, but it by no means qualifies as such and OSI will never certify it because doesn’t meet the definition of open source! Apparently, because they’ve got a bunch of money no one made a stink when they switched their license, and went from a legitimate “open source” company to well, shareware type license.

Matt Asay (smart, sharp, open source advocate) thinks it’s copacetic (check out the thread here). Is SugarCRM allowed to change the definition of open source to suit their own business model? Am I the only one willing to say without any standard (OSI) the term open source will become dilluted and viewed with skepticism?

PS – I think I’m just being awnry now… I should lay off it I suppose… Or invite John Roberts to have a beer and see if he can convince this skeptic it’s not shareware.

How about a Pete Finnigan Loop-du-jour

Apparently there are two classes of bloggers: those in the grace of the big O and those that are not. I like the big O (what puts food on my table so to speak) but find it silly to exclude bloggers based on content. How many bloggers post total CRAP that appears to be well intentioned tuning advice that could end up TOTALLY messing up an Oracle solution? Is blogs.oracle.com going to peer review and ban these bloggers as well? It’s not that it isn’t a good idea to keep GOOD content on the official blog site, it’s just HOW are you going to decide what’s good?

Just like a recent “Best Blonde Joke Ever” loop, I suggest the remaining bloggers offer up a Loop-du-jour. It might get me banned as well, but oh well! 🙂

I’ll start off… I rather like Pete Finnigans web site. Check it out here!

Five Tough Questions, HA!

I received an email for an online webinar on ESB (Enterprise Service Bus) products. The email claims to be a “tough as nails” get to the details type of webinar (usually good in my mind). They even listed the five tough questions they’re gonna grill the vendors with:

The Five Tough ESB Questions Will Get Answered!

  1. How do ESB architectures work with existing infrastructures
  2. What are ESB’s most popular features
  3. Can you show us some real-world user cases
  4. Please tell us about ESB Best Practices
  5. How are ESBs helping define SOA roadmaps for many firms

What a bunch of softballs! Tough Questions yeah right!

My favorite is number 2. That’s right, we’re going to grill you! What is your biggest selling point and why do users just LOVE your product. Puhhhlease.

ODTUG Desktop Conference

I’m looking forward to popping my virtual head into a few of the ODTUG Conference 2006 sessions. In particular the following look to be well worth the registration fee:

Mark Rittman
SolStonePlus
Oracle XML Publisher-What’s It All About?
Oracle XML Publisher is the hot new Oracle BI and reporting tool that lets you build production-quality reports using a Microsoft Word add-in. This presentation looks at what XML Publisher does, how it works, how you use it, and whether it’s a replacement for Oracle Reports.

Irene Chen
Solbourne
DBI: The Good, Bad, and Ugly—Comparing a Successful to a Not-So-Successful Implementation

Daily Business Intelligence (DBI) is an integrated out-of-the-box reporting and analysis application that enables managers and executives to see relevant, accurate, and timely information using self-service dashboards. However, depending on how DBI is implemented, a company can get great results that help improve various aspects of its business. We will compare two DBI implementations, and discuss best practices for key portions of the implementation process. This session is intended for functional and technical users who are responsible for planning the DBI implementation and who need a more in depth understanding of Daily Business Intelligence reporting.

Rene De Vleeschauwer
Ikan Software
Common Warehouse Metamodel (CWM) Compliant, Multi-Dimensional Modeling and Oracle Analytical Workspaces (AW)
This presentation will explain how to model an Oracle AW application using multi-dimensional techniques which are OMG/CWM-compliant and using an MDA architecture to generate the analytical workspaces.

Nicholas Goodman
Bayon Technologies, Inc.
Oracle Warehouse Builder 10gR2-Late, but PACKED with Features!

Oracle Warehouse Builder 10gR2 is packed with useful features and not just for the data warehouse professional. Improved ETL, expanded metadata capabilities, and advanced dimensional editors will mean a great deal to data warehouse developers. Features like model-based streams integration and the data profiling/cleansing features will even make DBAs sing Oracle Warehouse Builder praises.

Had to throw in the shameless plug for my own presentation!

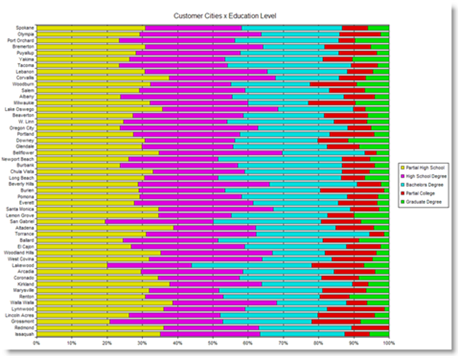
This Graph is VERY special!

What’s so special about this graph? Well, other than the fact that it’s a really cool way to translate an XML document into a visual HTML report (this isn’t an image, it’s actually an HTML document) the technologies used to produce it are REALLY compelling. Chris Harrington and I spent a couple of hours this morning, working to generate a few reports using both of our “technology stacks” and with just a few small adjustments we were able to do something that spells big potential.

Let me first describe exactly how this chart was built:

  • An XMLA request was passed OVER THE INTERNET (from Pittsburgh to Seattle) from the ThinOLAP command line XMLA client to a Mondrian instance I have running in my lab.
  • The XMLA request was parsed and passed to the Mondrian ROLAP server that issued JDBC calls to my BizGres database.
  • My BizGres database executed a handful of SQL statements that Mondrian used to generate the actual data values for the MDX query passed from across the country.
  • The XMLA response was sent back OVER THE INTERNET (from Seattle to Pittsburgh) to the ThinOLAP command line.
  • The ThinOLAP then did a post processing XSLT transformation to take the boring XMLA results (ie, pure data) and turn it into a really compelling chart.

Why is this exciting?

First off, because it’s using XML for Analysis which was supposed to be a hot ticket item, but has less than stellar support from vendors (including the 8000 lb guerrilla that “supports” the standard). There are a handful of XMLA clients, almost ALL of which are tied up in “dot net this” and “dot net that” and are clearly written to work with SQL Server 2005 Analysis Services. Mondrian happens to be the only other PUBLIC/PRODUCTION OLAP server that implements the interface (if the other vendors are actually public with their XMLA providers please let me know on email). We proved that the standard is pretty sound and that with small amounts of tweaking interoperation is pretty straightforward! UPDATE: I’ve just read that HYPERION has a provider, but I’m uncertain of how useful it is in practice. It also appears that SAS has a provider but again I’m not sure if there any clients that aren’t fused to the existing MS technologies (OLEDB etc).

Secondly, because it’s running over the Internet at pretty respectable speeds. Between two remote offices the REQUEST/RESPONSE was reasonable (a couple of seconds). This is one of the first times I’ve actually received some benefit from a SOA perspective over the Internet. Chris and I figured it was HTTP, there was no need shipping software back and forth we just did some port forwarding and it all worked BRILLIANTLY. We proved that XMLA can work, reasonably, over the public internet.

Thirdly, the server side is 100% OSI Certified software. That’s right… my provider was serving up OLAP goodies using Linux, Tomcat, Mondrian (part of the Pentaho platform), and BizGres. There were ZERO proprietary applications running to build and deliver the XMLA responses. The XMLA client (ThinOLAP) is an freeware product that uses from Microsoft packages for XML processing, scripting, transformations, etc. We proved that one can build an open source OLAP solution that can be leveraged by whizbang clients.

Beyond open source, Mondrian is a JDBC ROLAP server so it can be plugged into just about any database that supports JDBC. Choice is GOOD! Oracle anyone? The potential of actual interoperating XMLA clients is HUGE! Think about how many boutique visualization, charting, and reporting engines have been fused to OLE DB and other proprietary protocols. Perhaps a handful interoperating clients/servers will entice the others to write to the actual standard?

Chris and I continue to work at seeing what potential exists for interoperating his Intrasight Product with Mondrian. If you’re interested in using Mondrian or a nice AJAX client for Mondrian please don’t hesitate to be in touch with either of us in this regard.